
General Drought Information
|
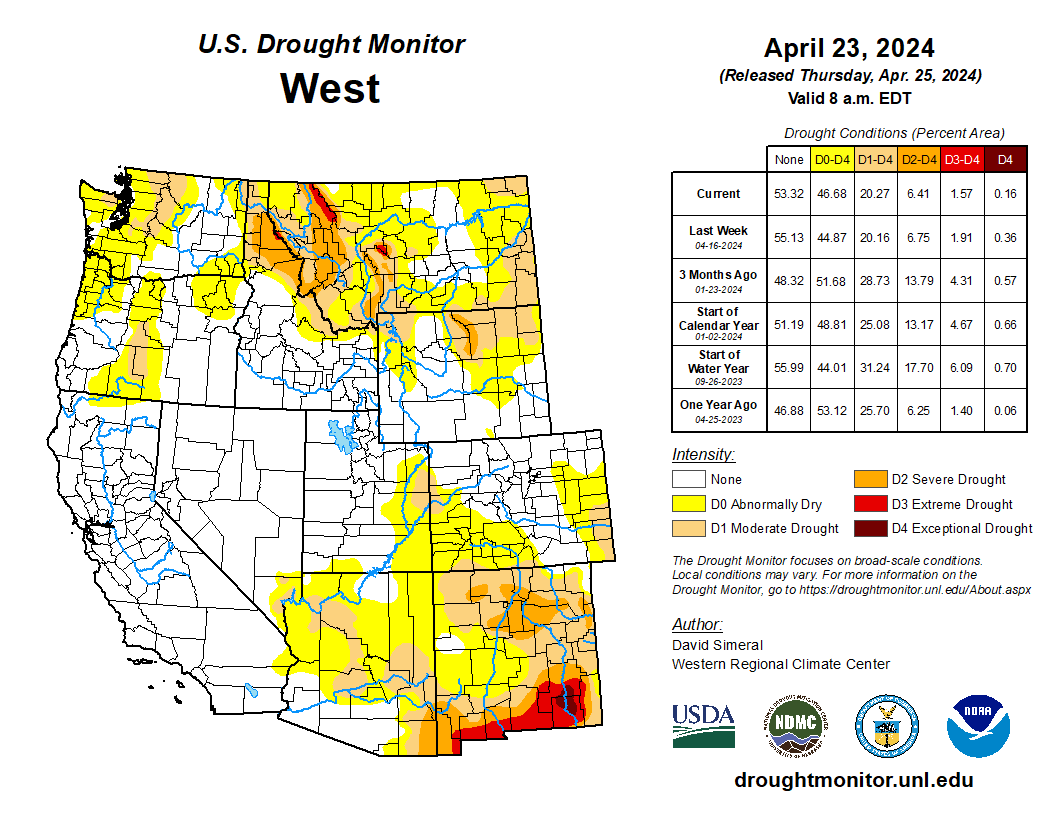
Latest West
Drought Monitor
The US Drought Monitor is updated weekly and is a synthesis of
multiple indices and impacts that represents a consensus of federal
and academic scientists. The US Drought Monitor is produced in
partnership between the National Drought Mitigation Center at the
University of Nebraska-Lincoln, the United States Department of
Agriculture, and the National Oceanic and Atmospheric Administration.
Map courtesy of NDMC-UNL.
|
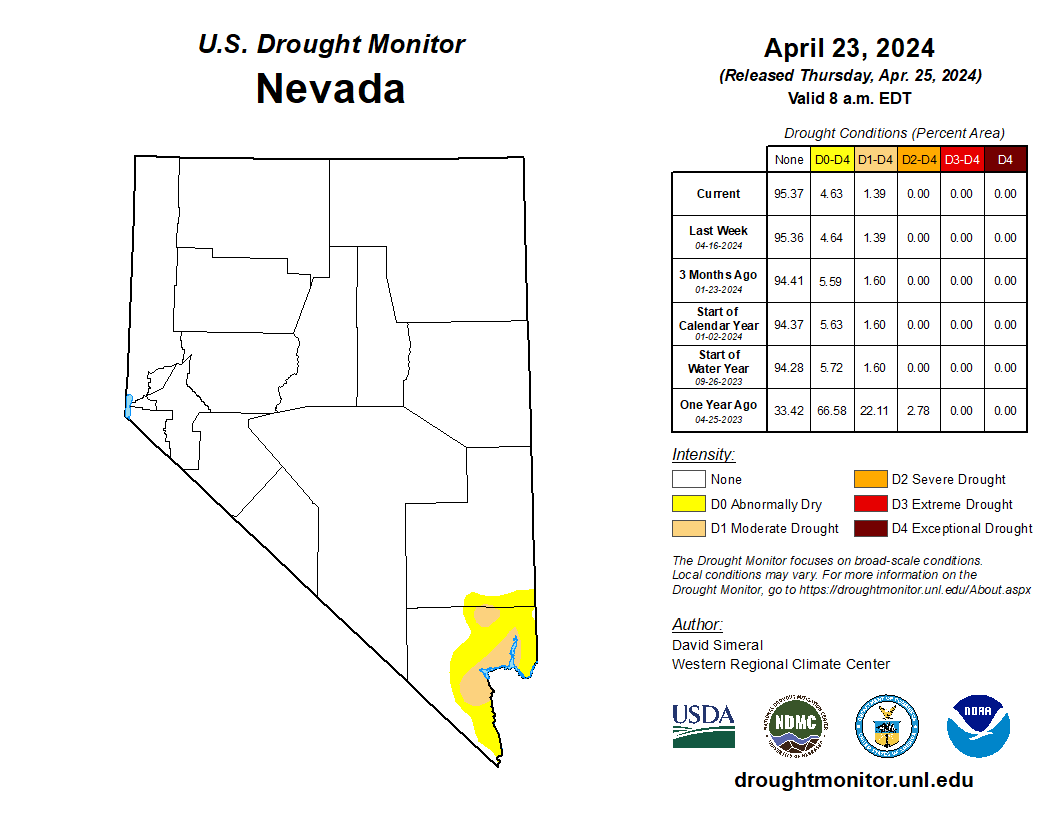
Latest Nevada
Drought Monitor
The US Drought Monitor is updated weekly and is a synthesis of
multiple indices and impacts that represents a consensus of federal
and academic scientists. The US Drought Monitor is produced in
partnership between the National Drought Mitigation Center at the
University of Nebraska-Lincoln, the United States Department of
Agriculture, and the National Oceanic and Atmospheric Administration.
Map courtesy of NDMC-UNL.
|
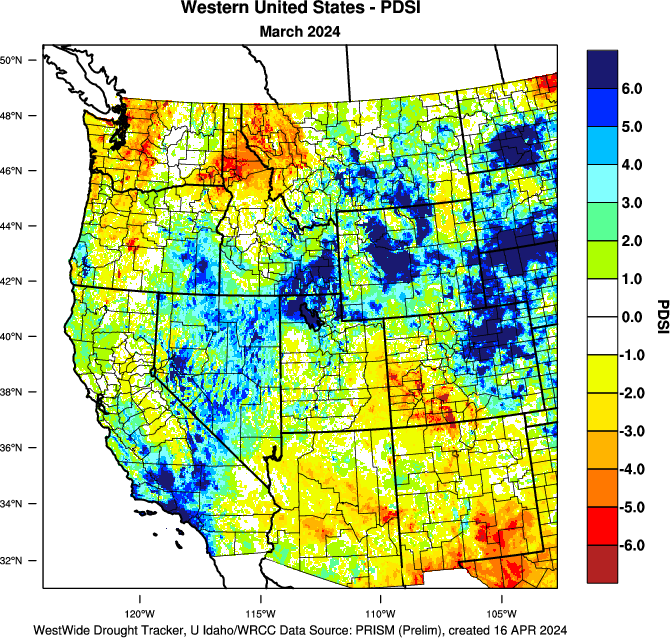
Palmer Drought Severity
Index (PDSI)
The Palmer Drought Severity Index (PDSI) map from the Westwide Drought
Tracker is updated monthly. PDSI is based on a simplified
water budget that considers temperature, precipitation, and soil
moisture data to determine the accumulated water excess or deficit.
Negative values (yellow and red shades) show abnormal dryness to
extreme drought. Positive values (shades of blue and green) indicate
an excess of precipitation in an area.
|
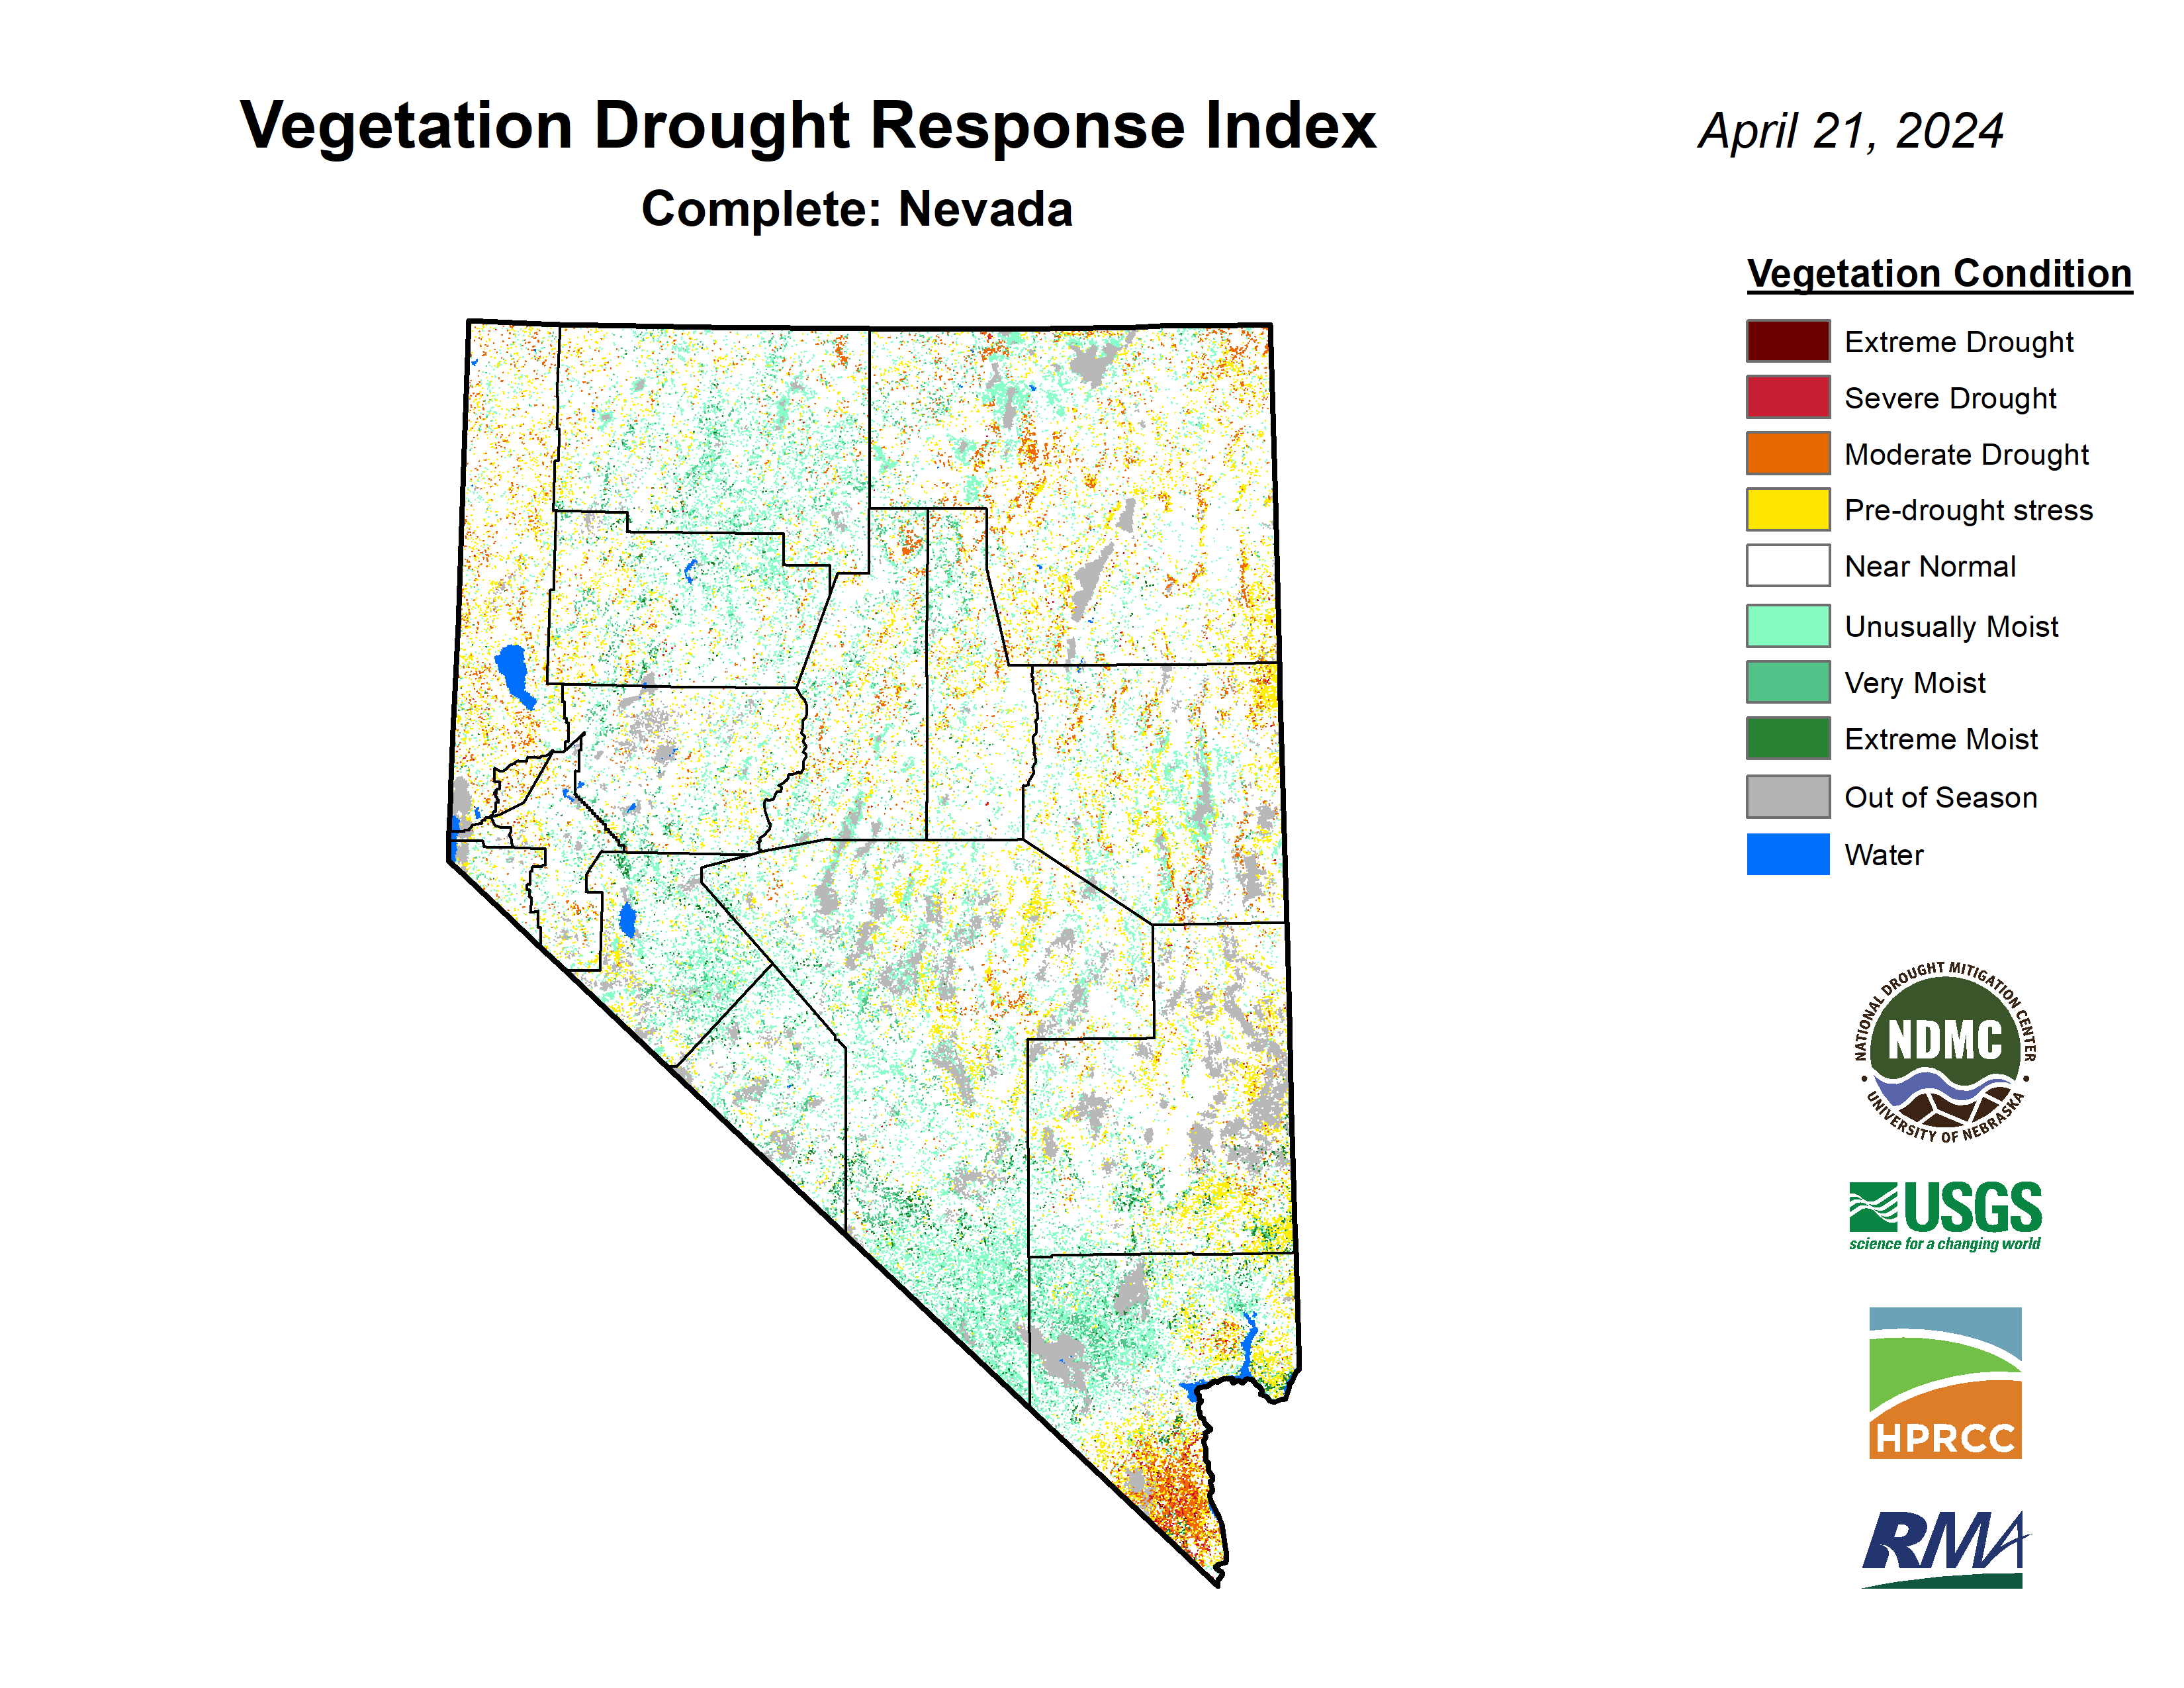
Vegetation Drought
Response Index
VegDRI is updated bi-weekly and is a depiction of vegetation
stress across the contiguous United States. The index is calculated
using fine resolution satellite data combined with climate and
biophysical data. Multiple factors such as climate, pests, land use
change, fire, and extreme weather events can influence vegetation
conditions, so including climate and biophysical data helps
distinguish stress due to drought.
|
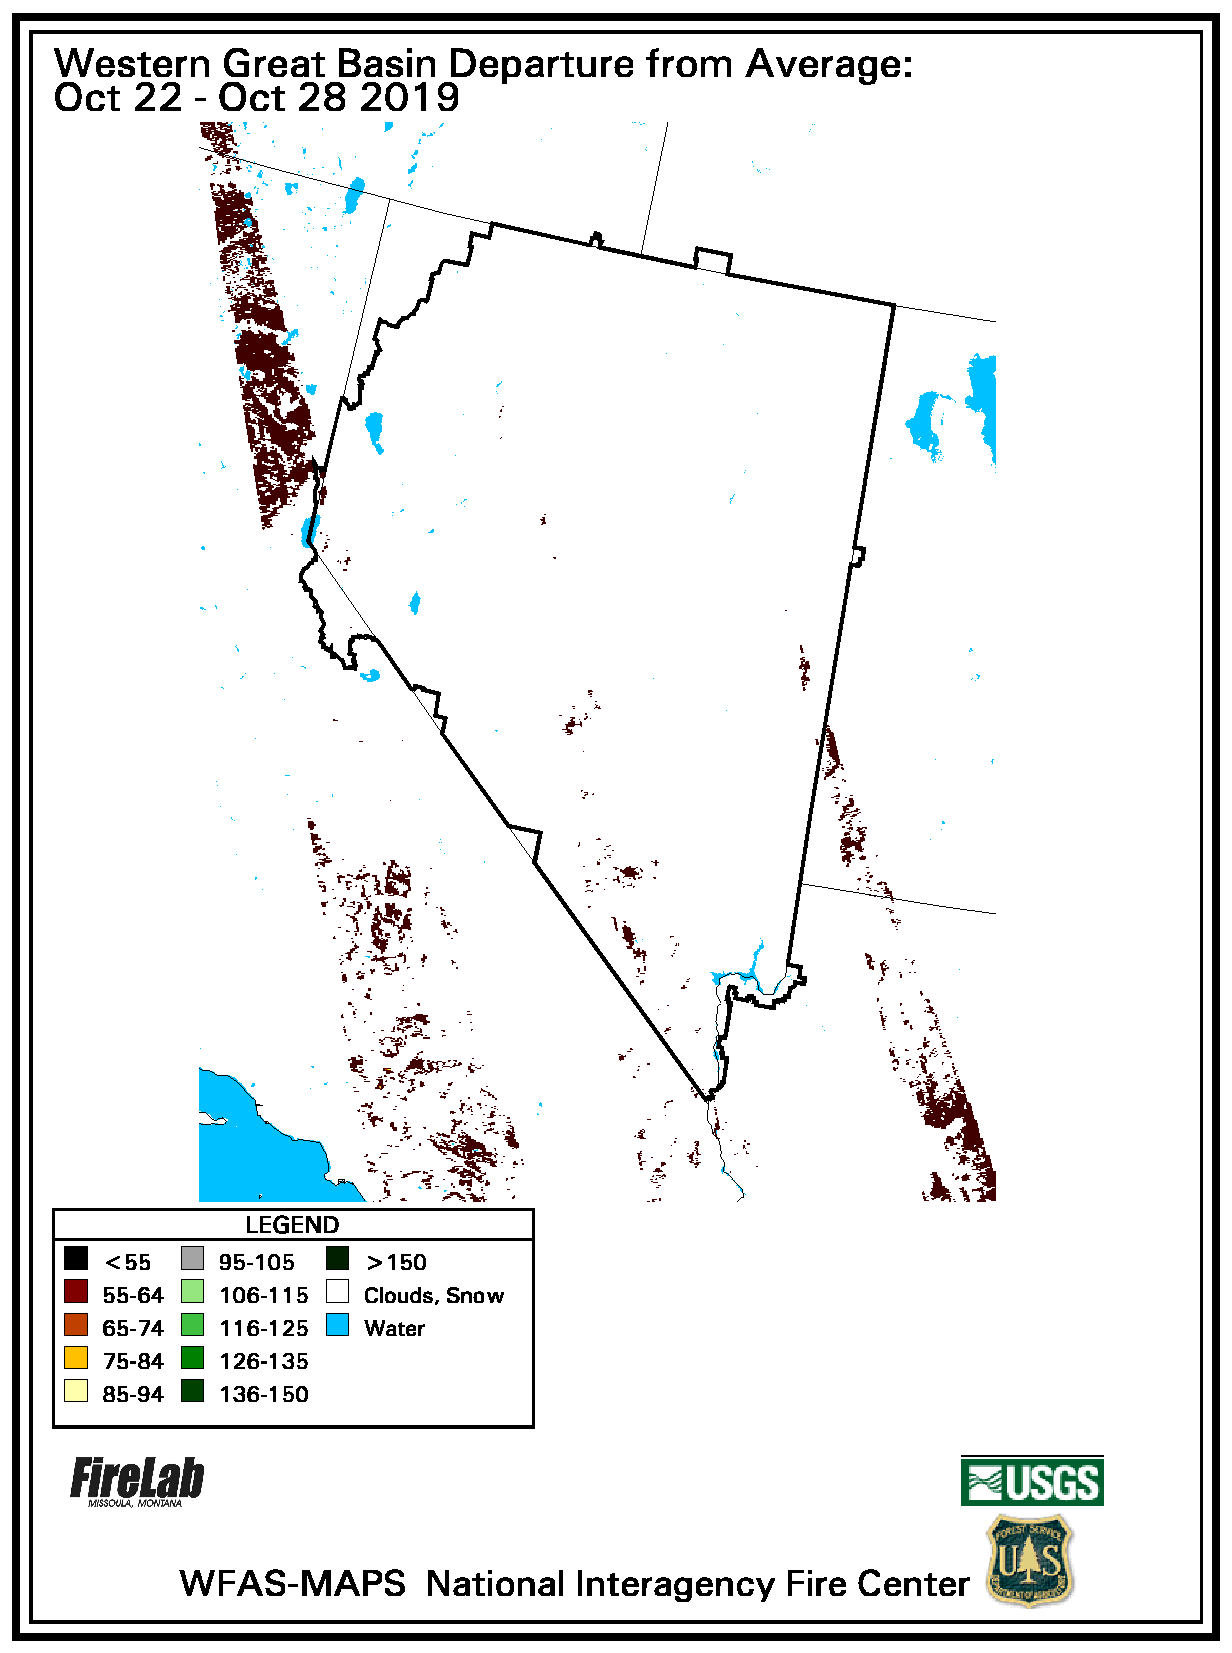
Departure from
Average Greenness
Departure from average greenness (DAG) maps are updated weekly
using data from AVHRR satellite observations at a resolution of
1.1 km (0.6 mi). These maps portray how green each pixel of the image
is compared to its average greenness for the current week of the year
based on 1989-2003 data. Factors such as cloudiness, snow smoke, or
haze can reduce the data quality.
|
|---|---|---|---|---|
|
|
|
|
|
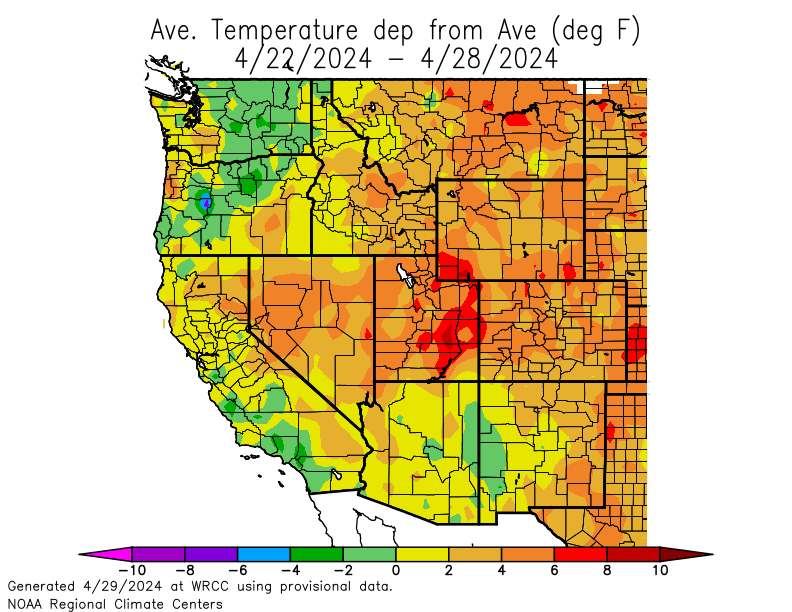
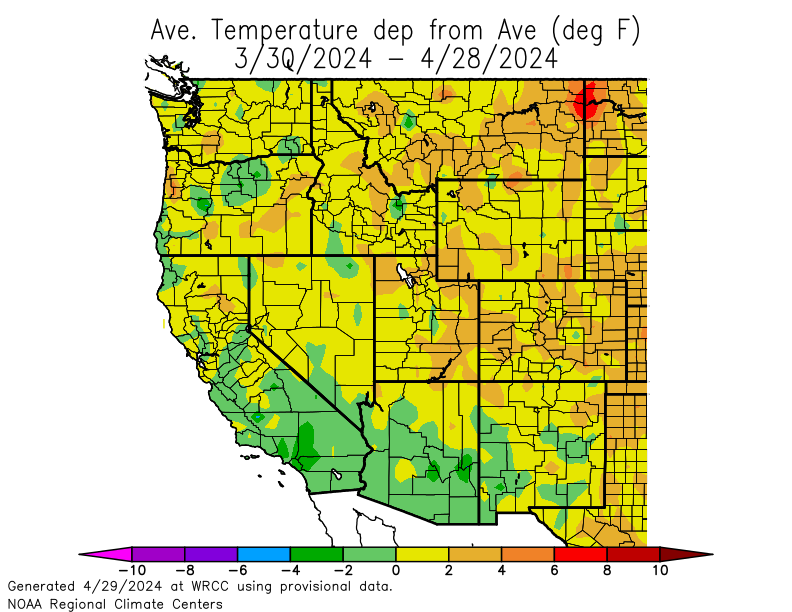
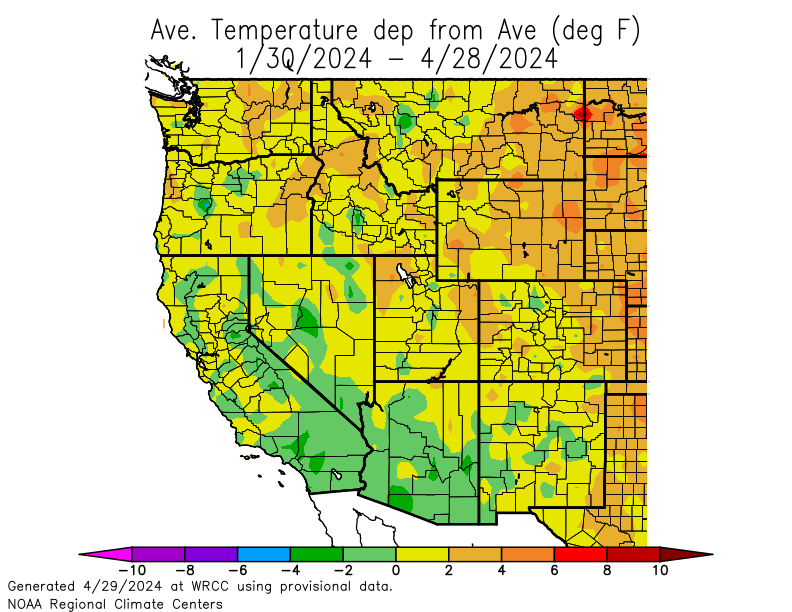
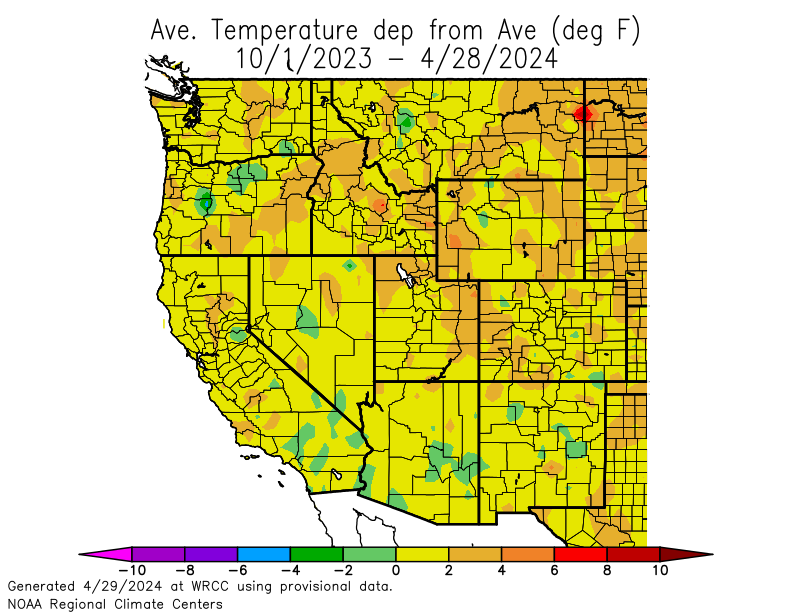
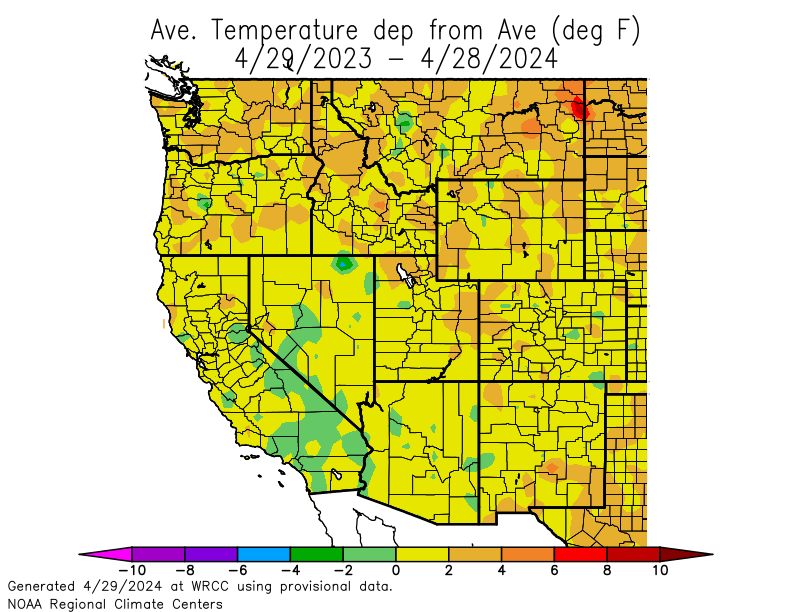
Average Temperature Departure from Normal

Updated daily. Departure of average temperature from the 1981-2010
NCDC normal for the given time period.
| Last 7 days | Last 30 days | Last 90 days |
Water Year (since Oct 1) |
Last 12 months |
|---|---|---|---|---|
|
|
|
|
|
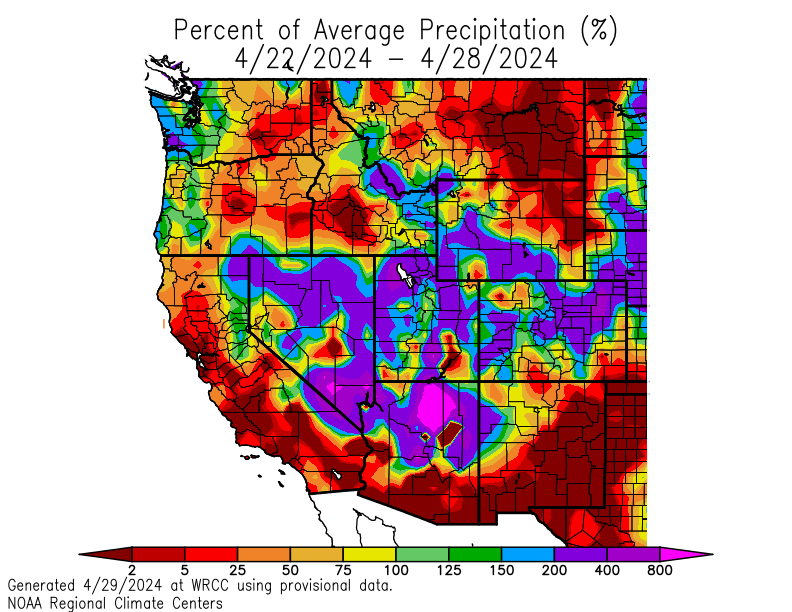
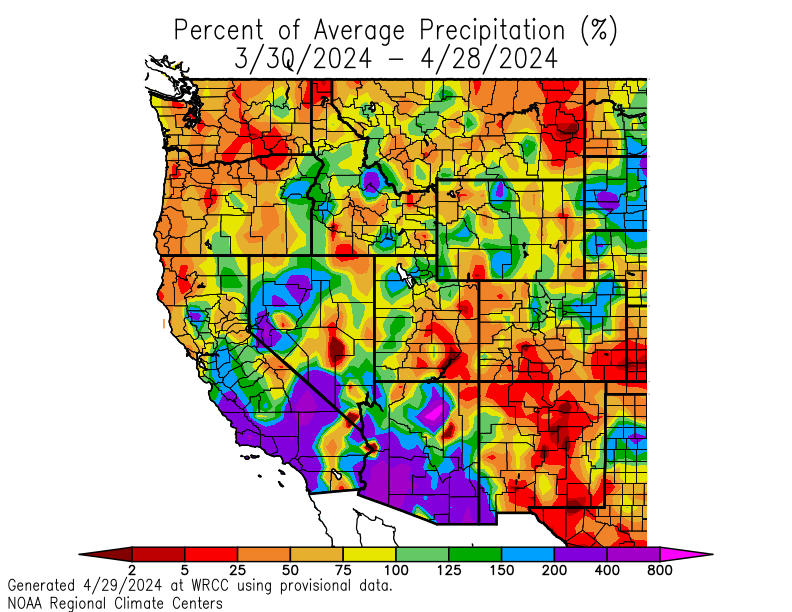
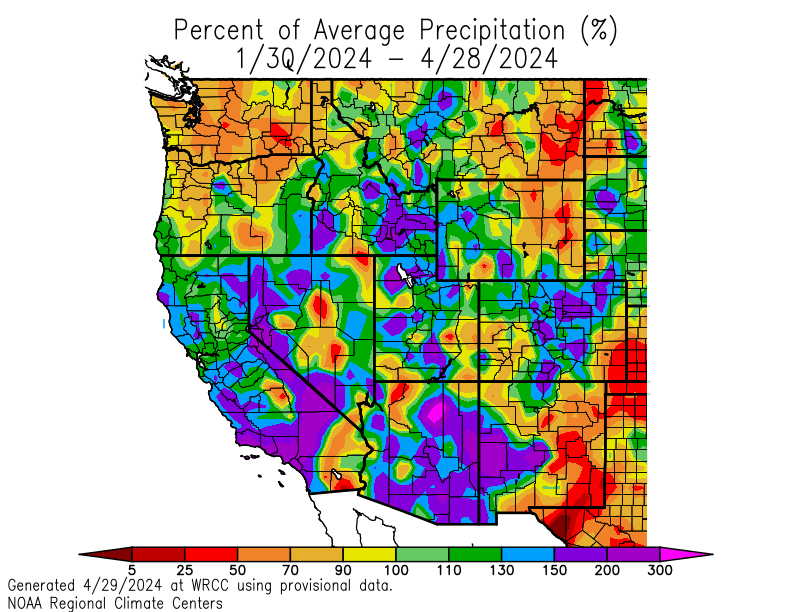
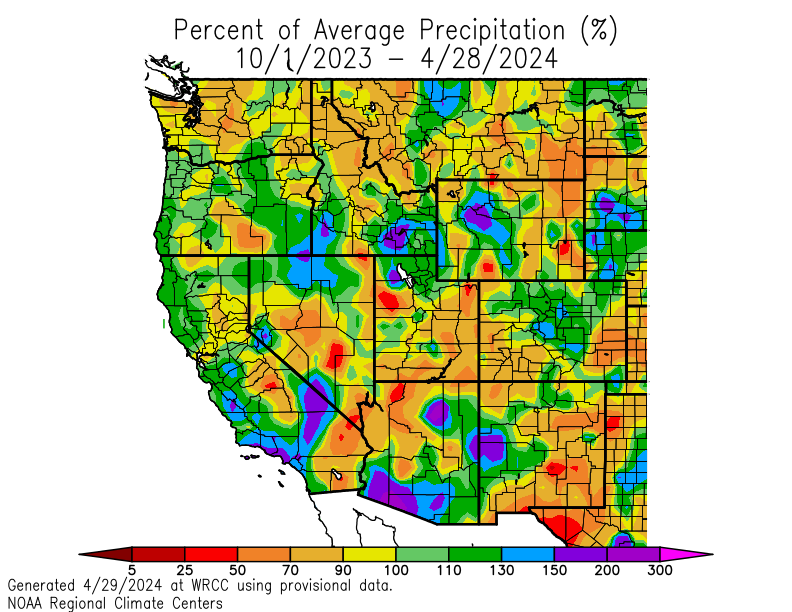
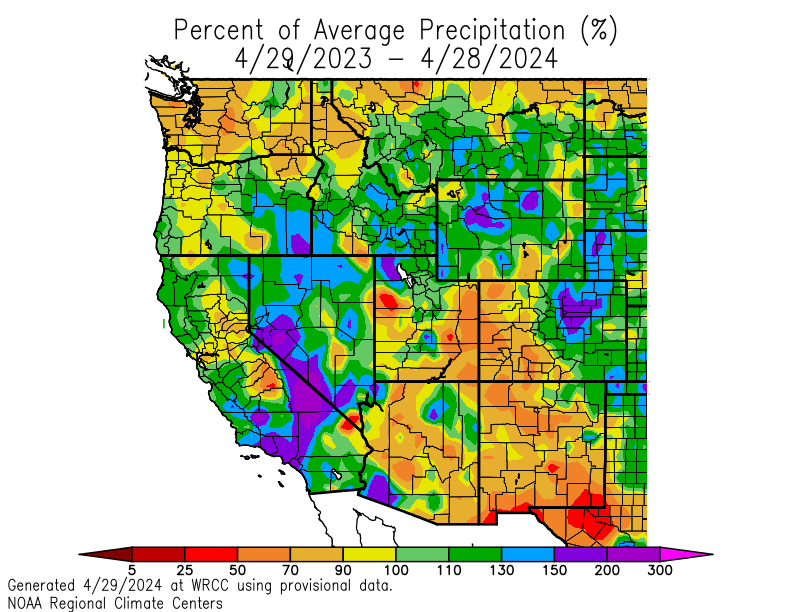
Precipitation Percent of Normal
Updated daily. Percent of the 1981-2010 NCDC normal percipitation
value at each station for the given time period.
| Last 7 days | Last 30 days | Last 90 days |
Water Year (since Oct 1) |
Last 12 months |
|---|---|---|---|---|
|
|
|
|
|
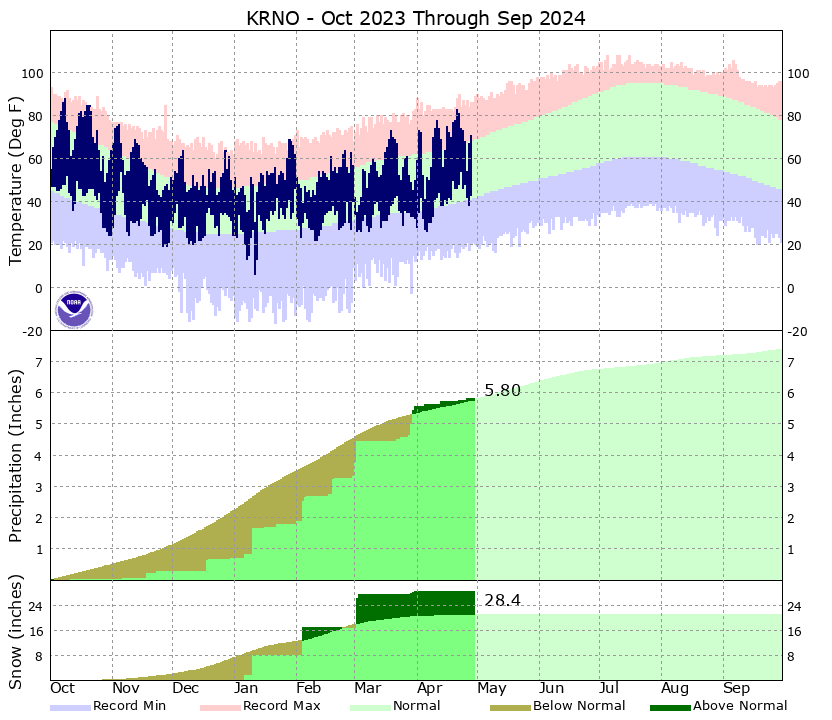
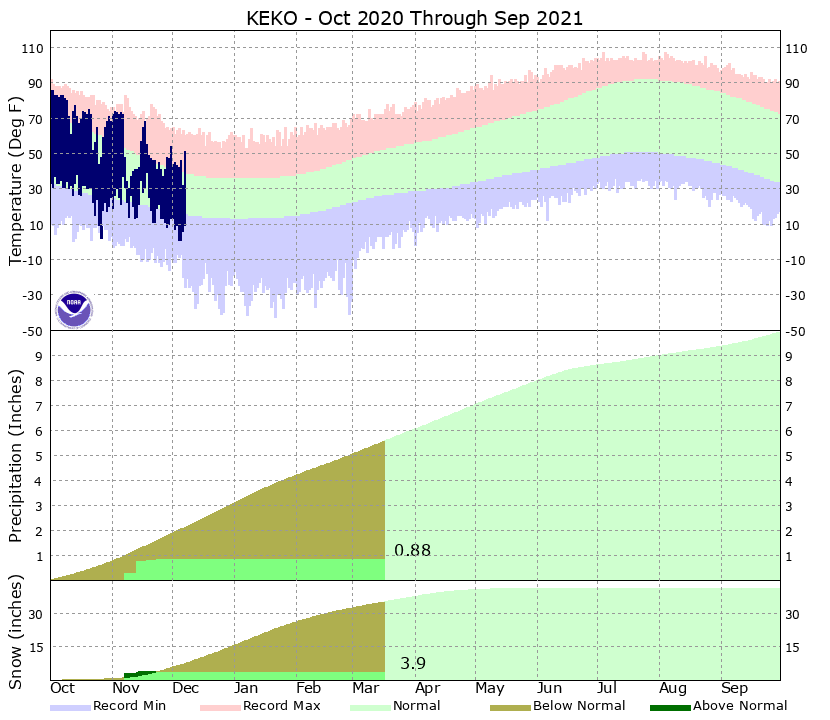
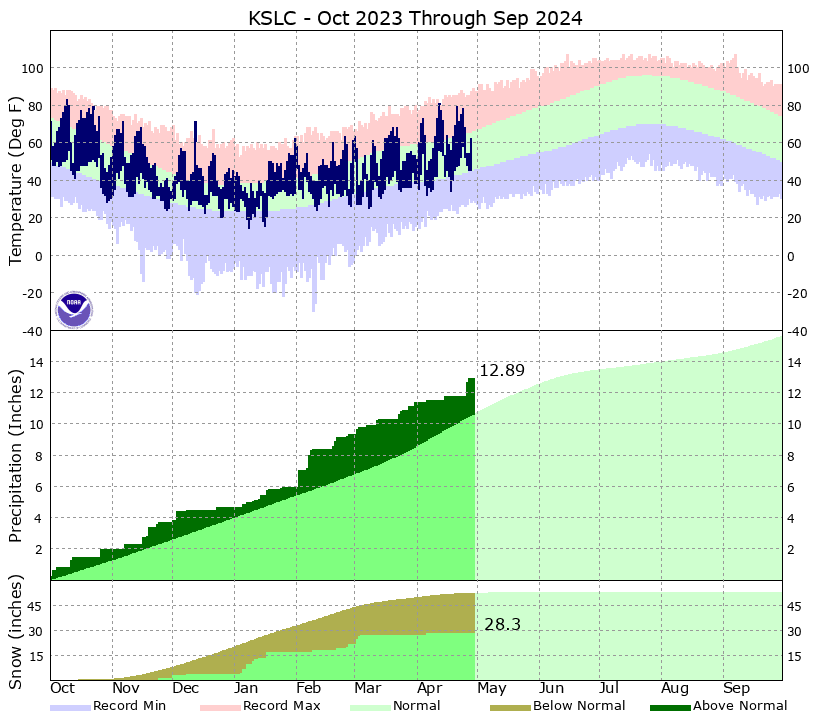
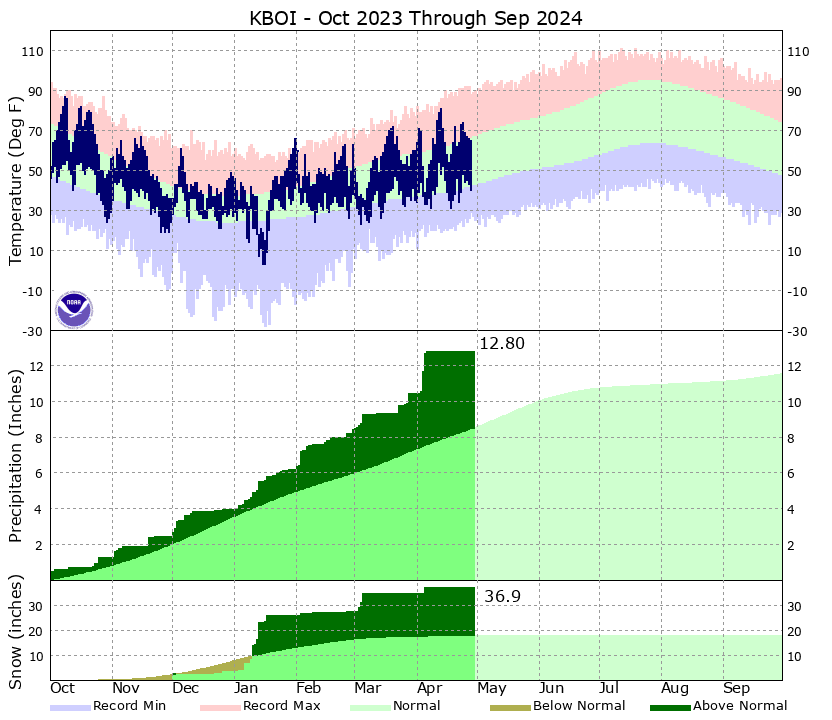
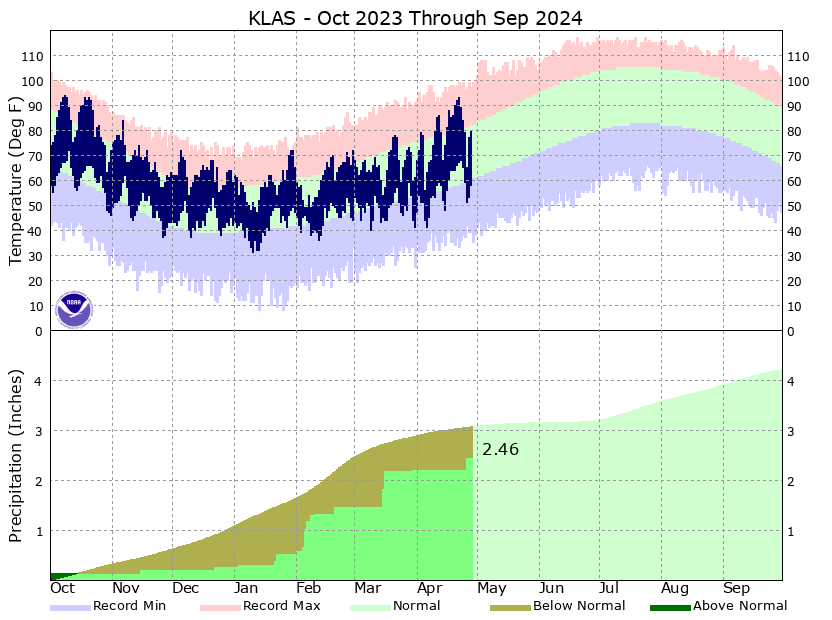
NWS Observations, Normals, and Records for Current Water Year
Updated daily. Station-based climate information for various
locations in the Great Basin. Extreme high and low temperature records
for a day of the year are indicated by the blue and red bars. The normal
range is shown in green. For precipitation, normal annual accumulations
are shown in light green. Actual water year-to-date precipitation is
shown in mint green. The deficit between the two is shown in brown.
| Reno, NV | Elko, NV | Salt Lake City, UT | Boise, ID | Las Vegas, NV |
|---|---|---|---|---|
 o o
|
|
|
|
|
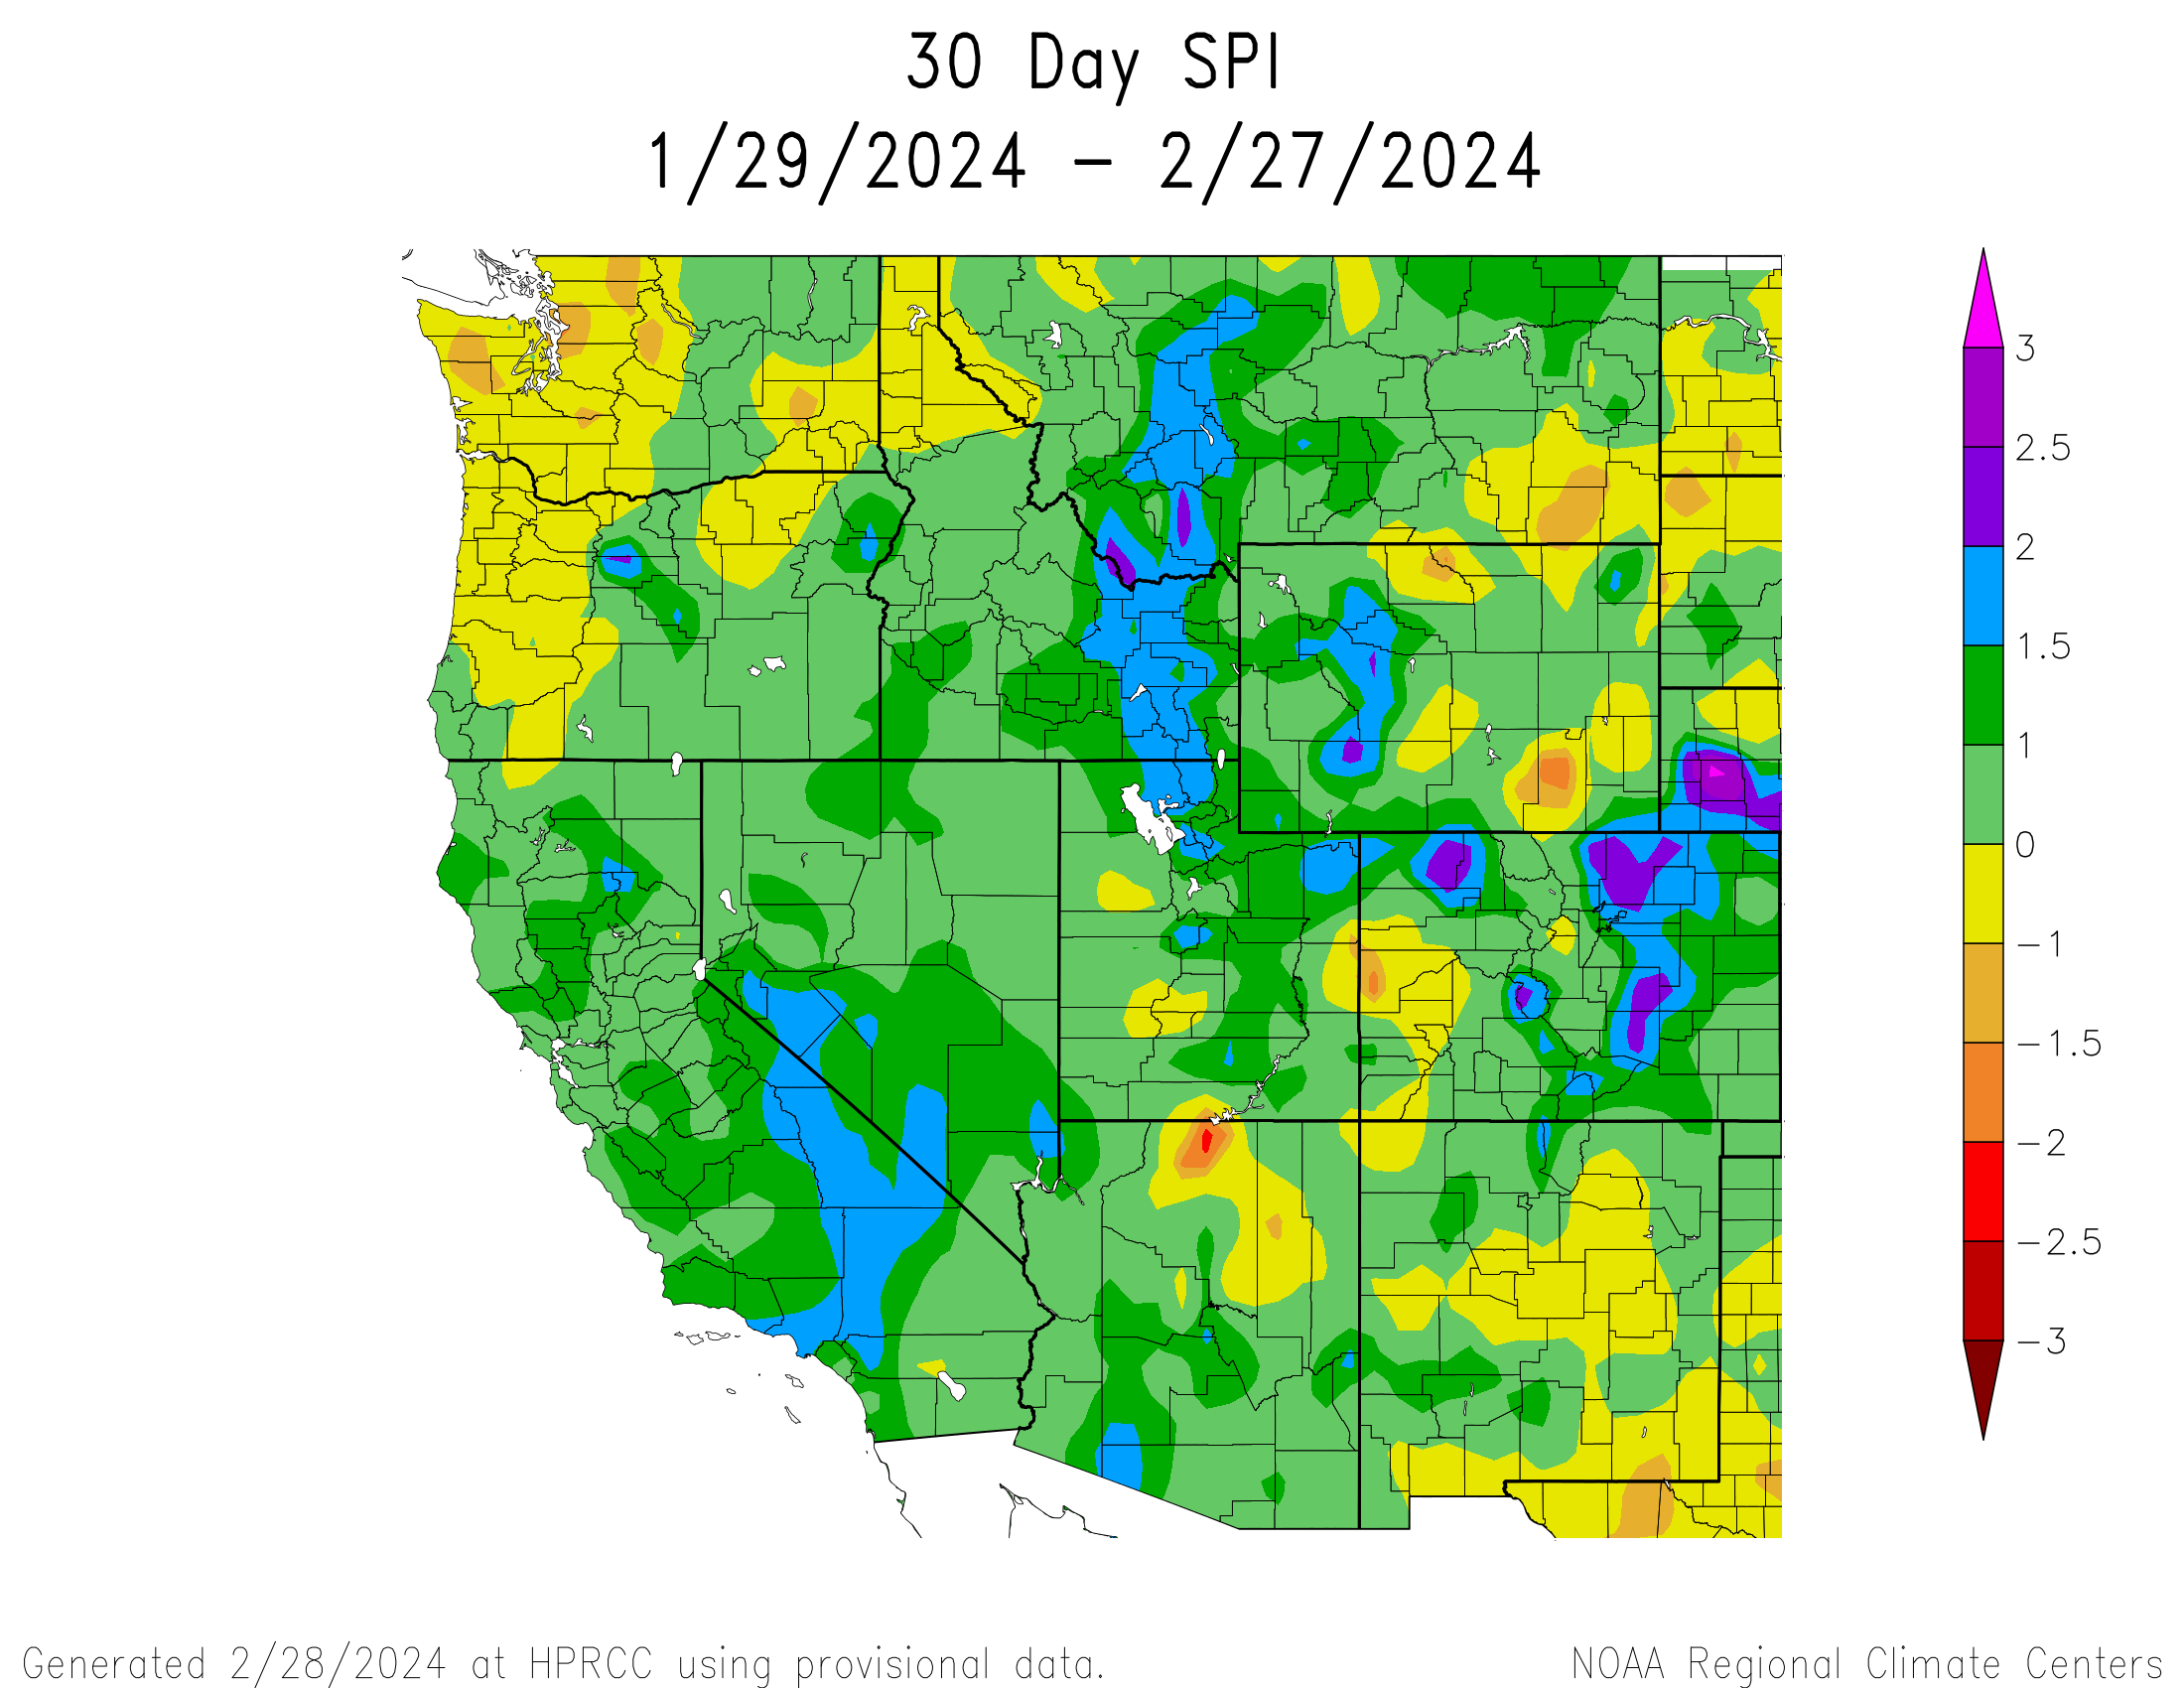
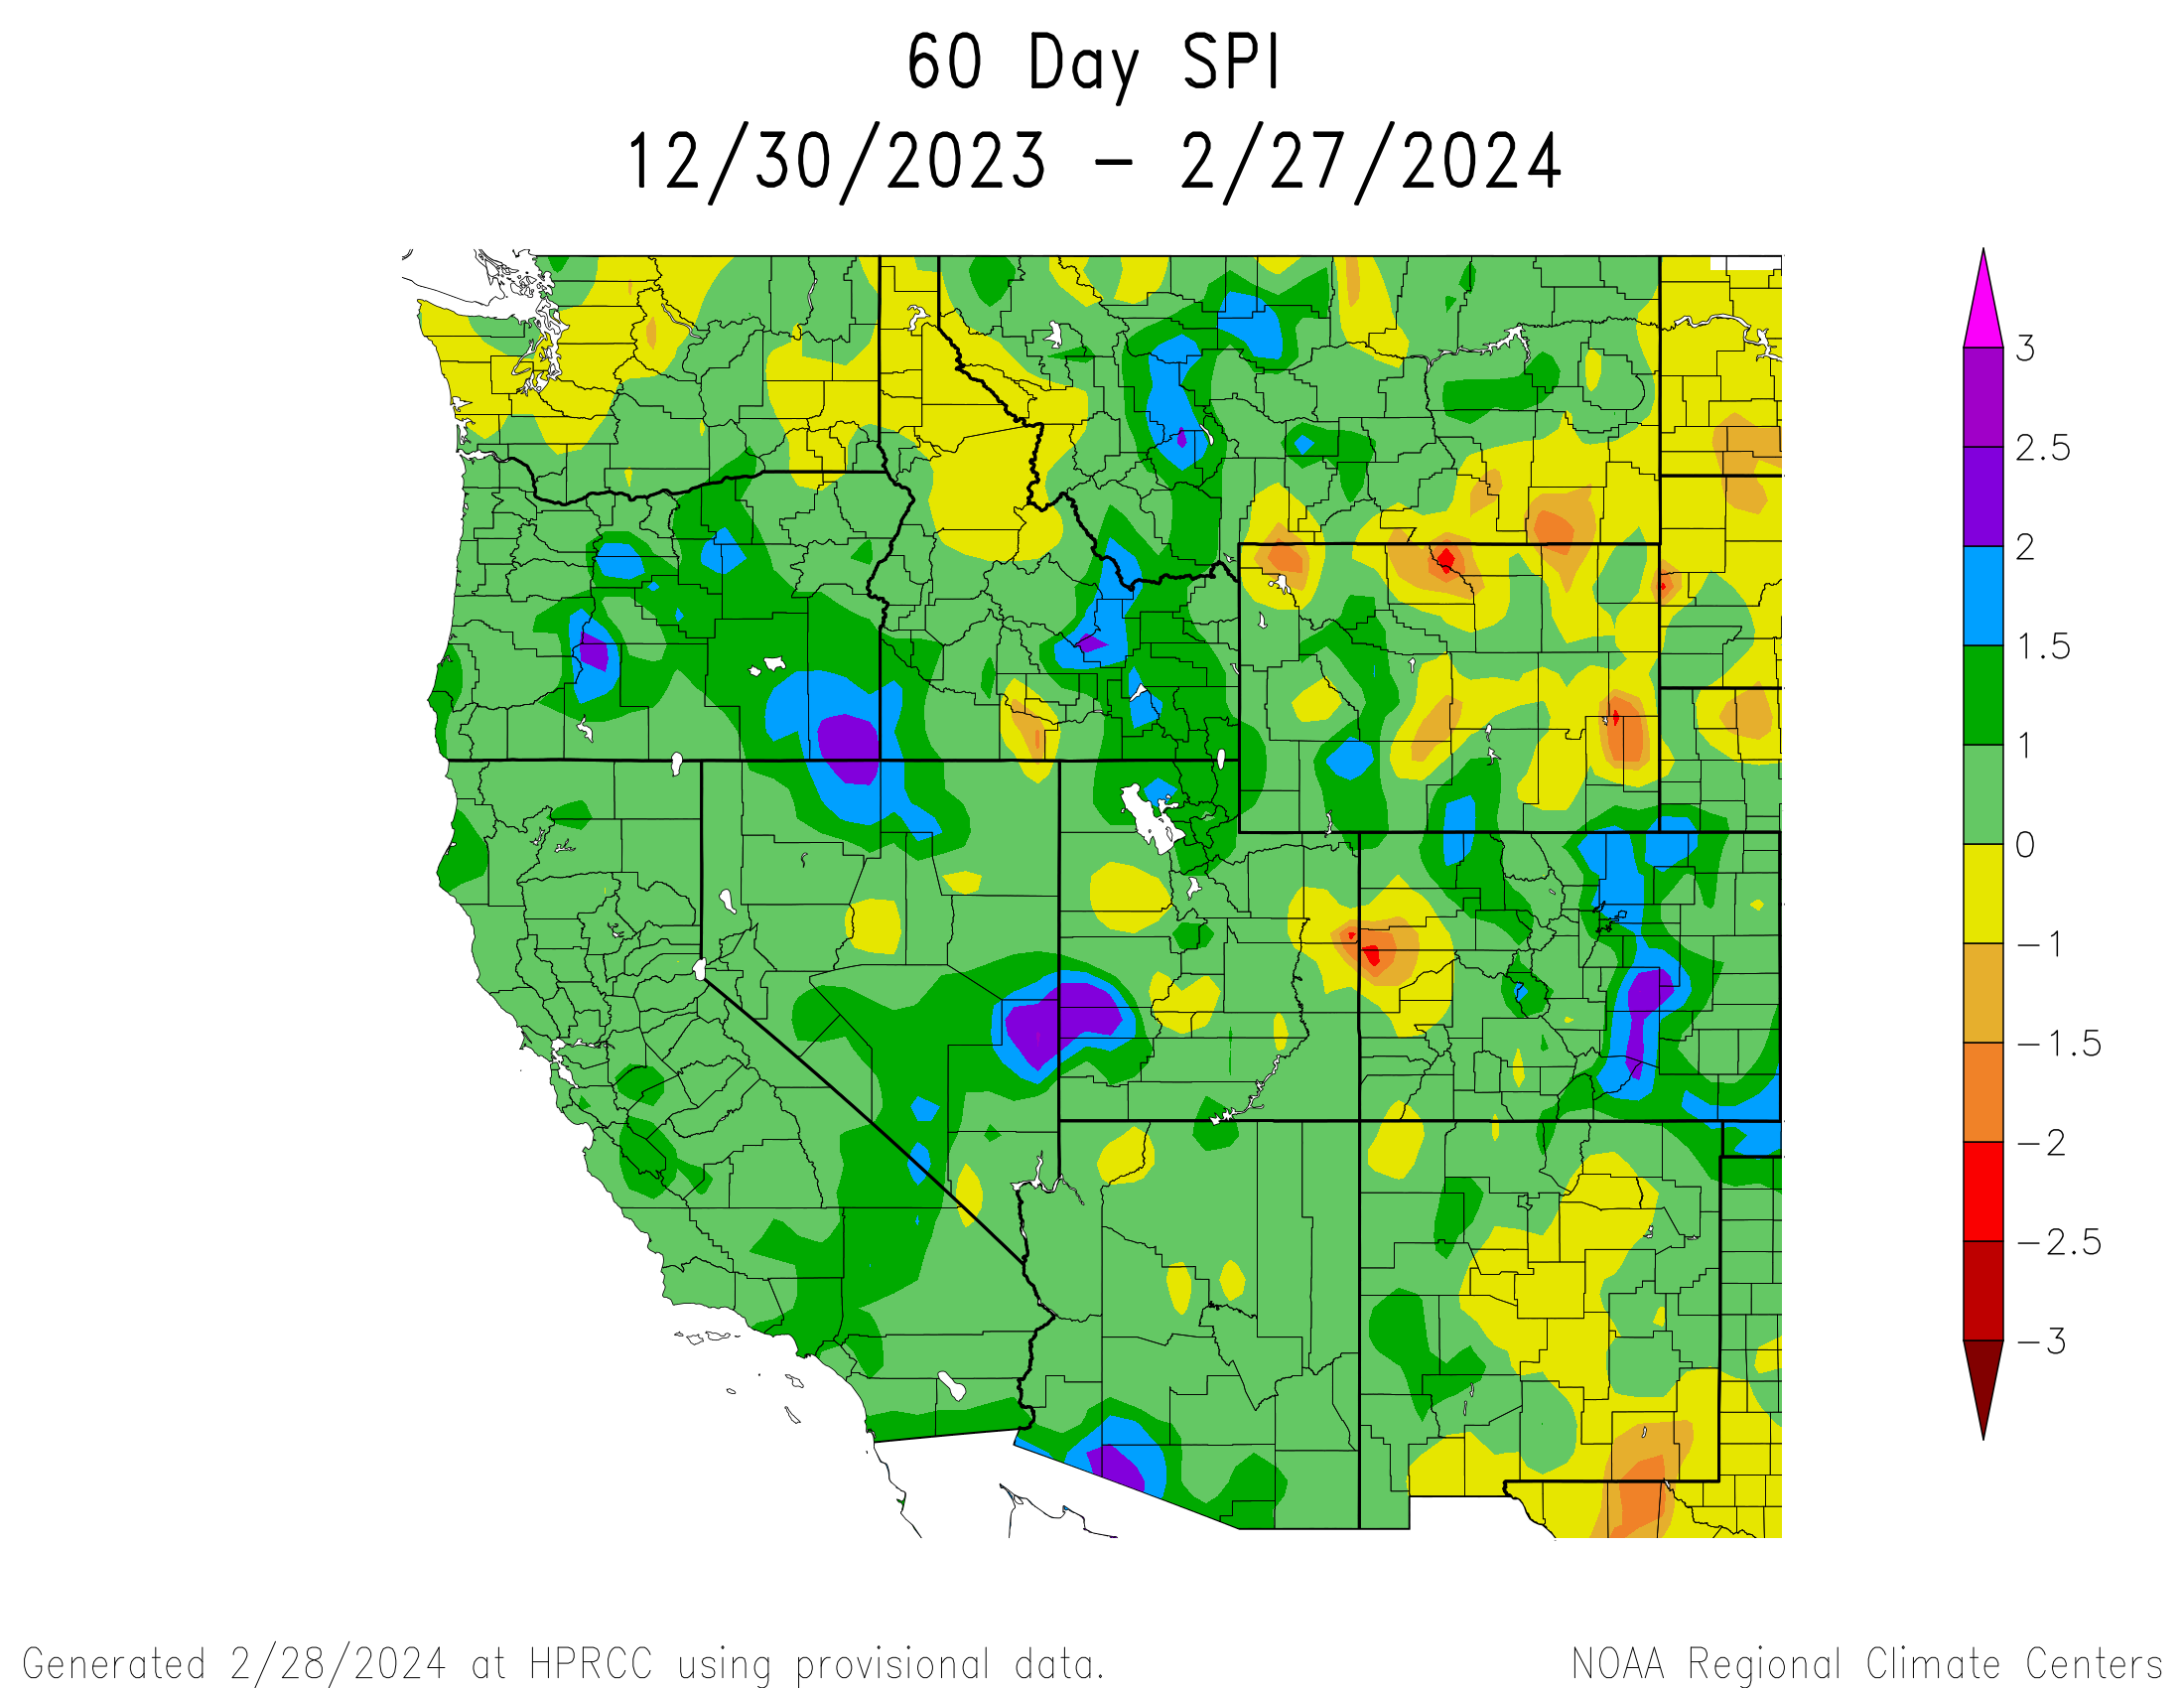
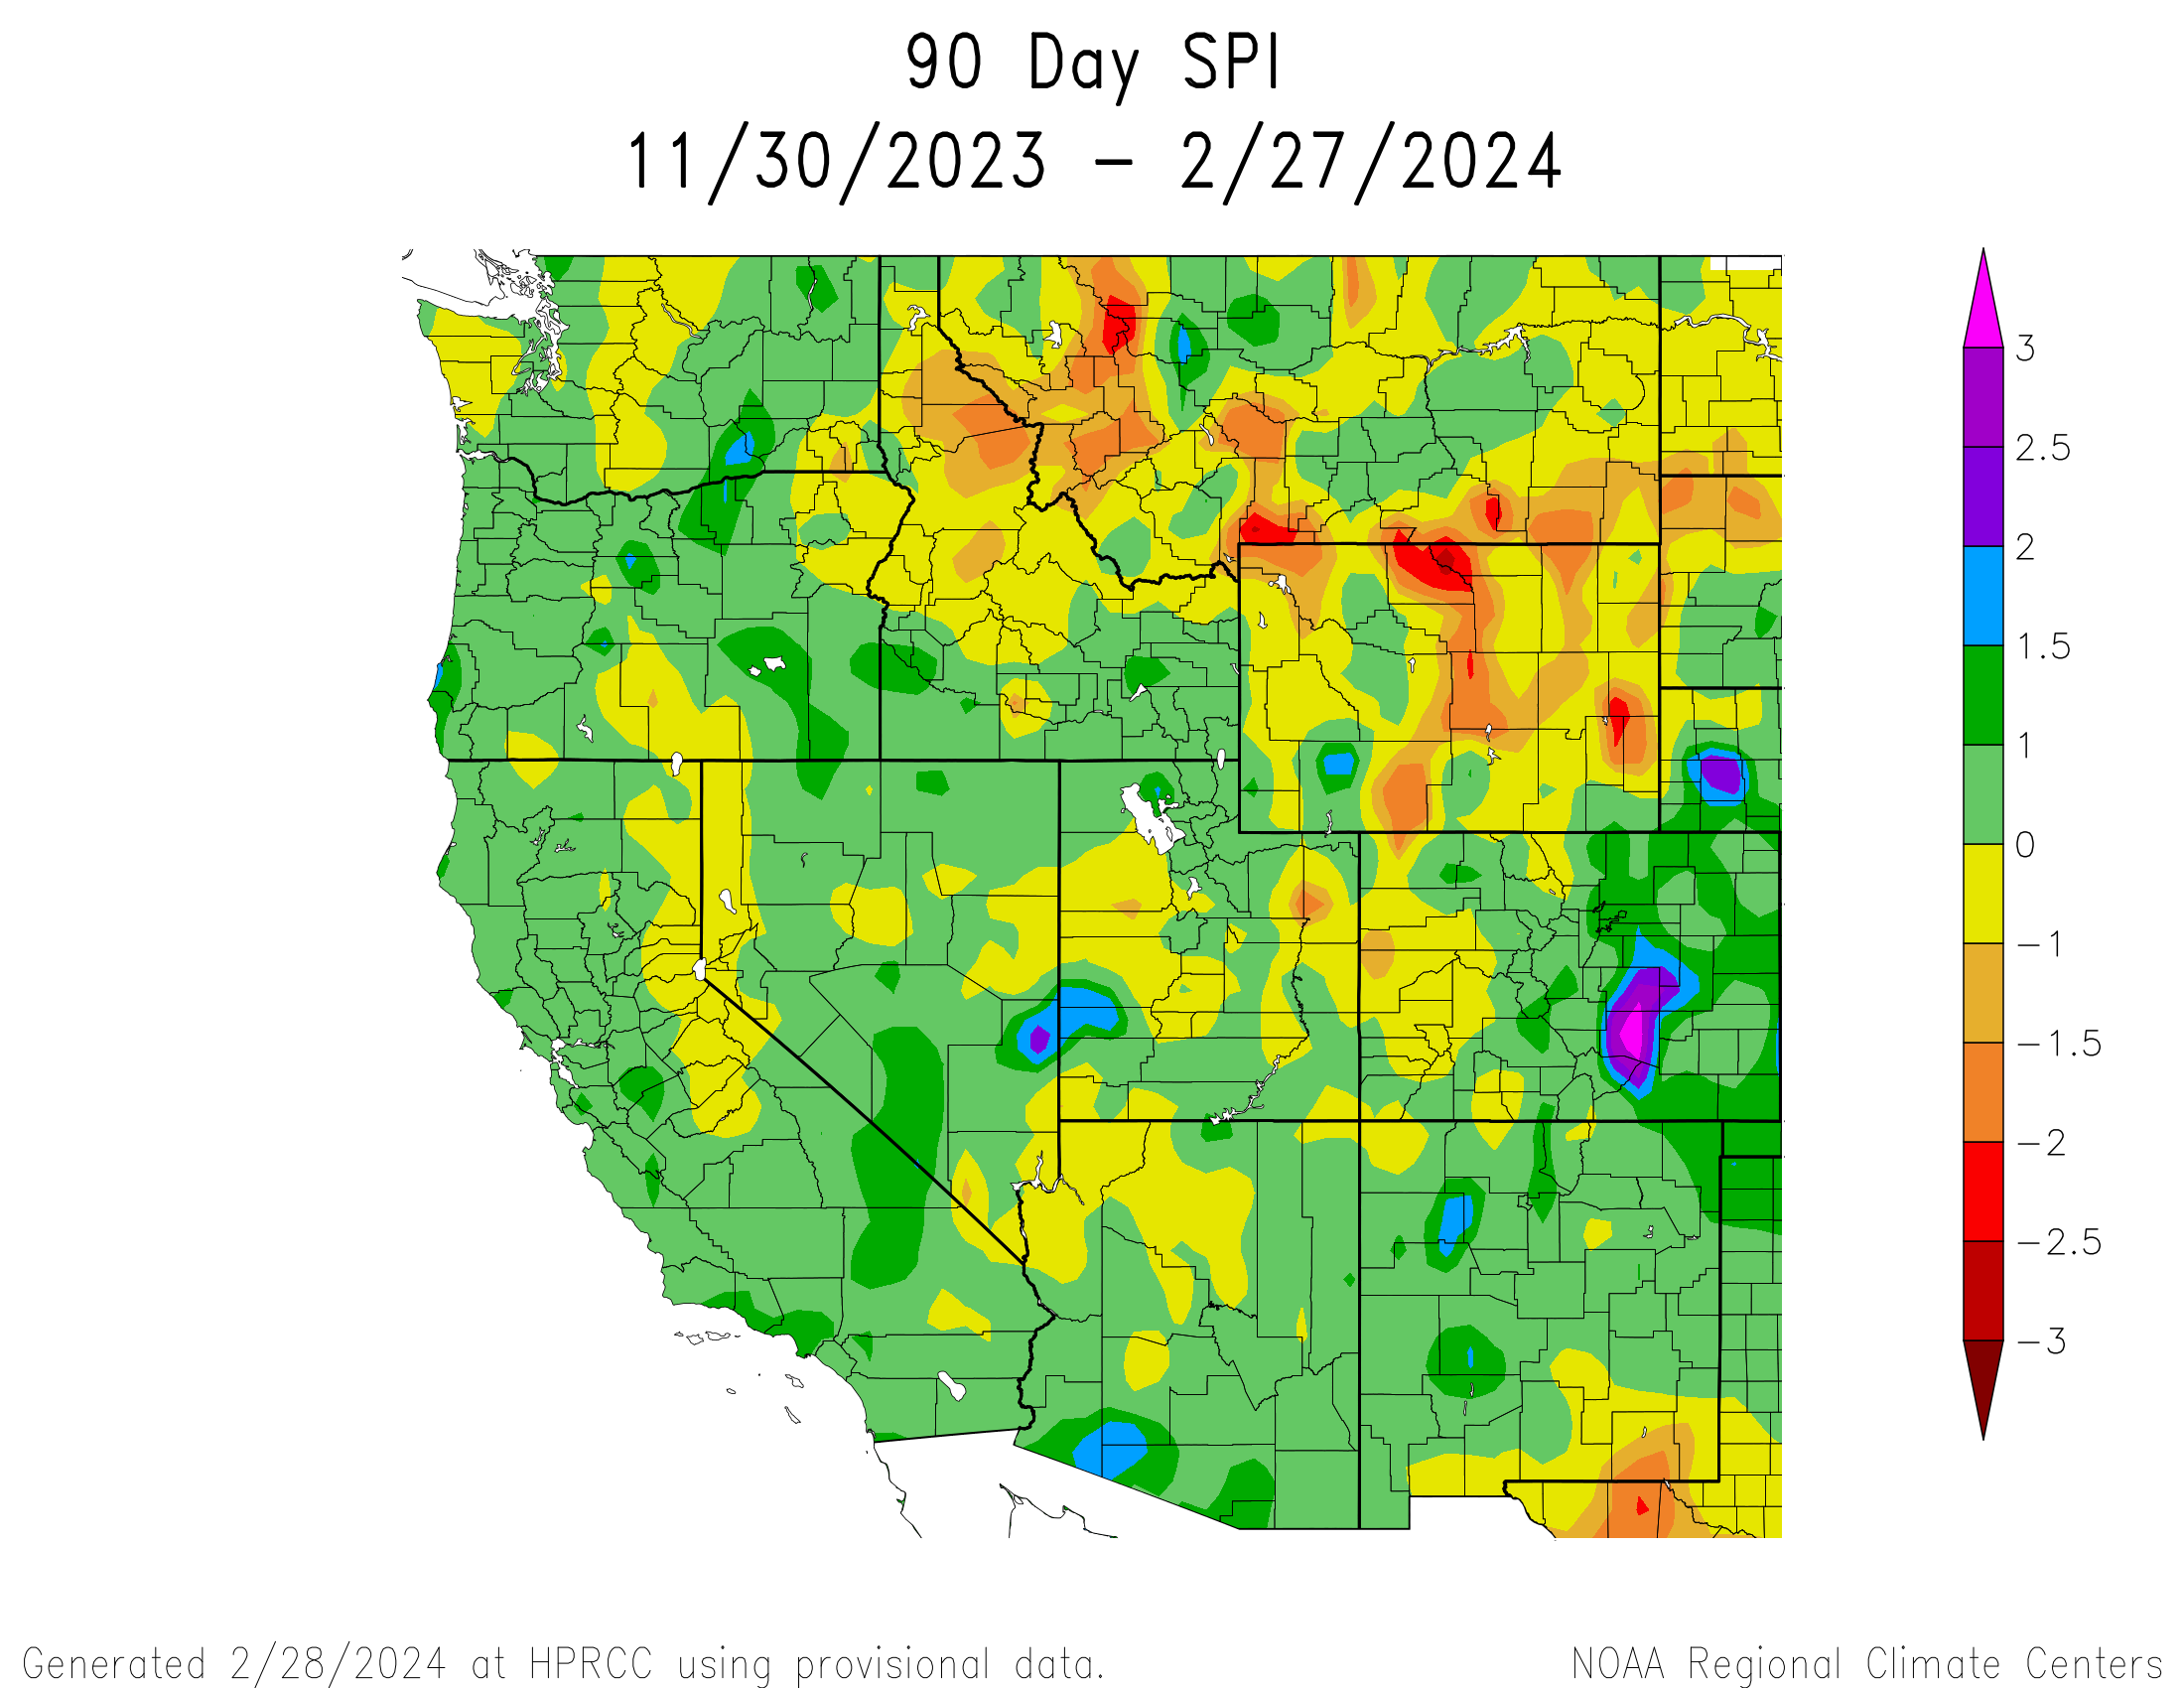
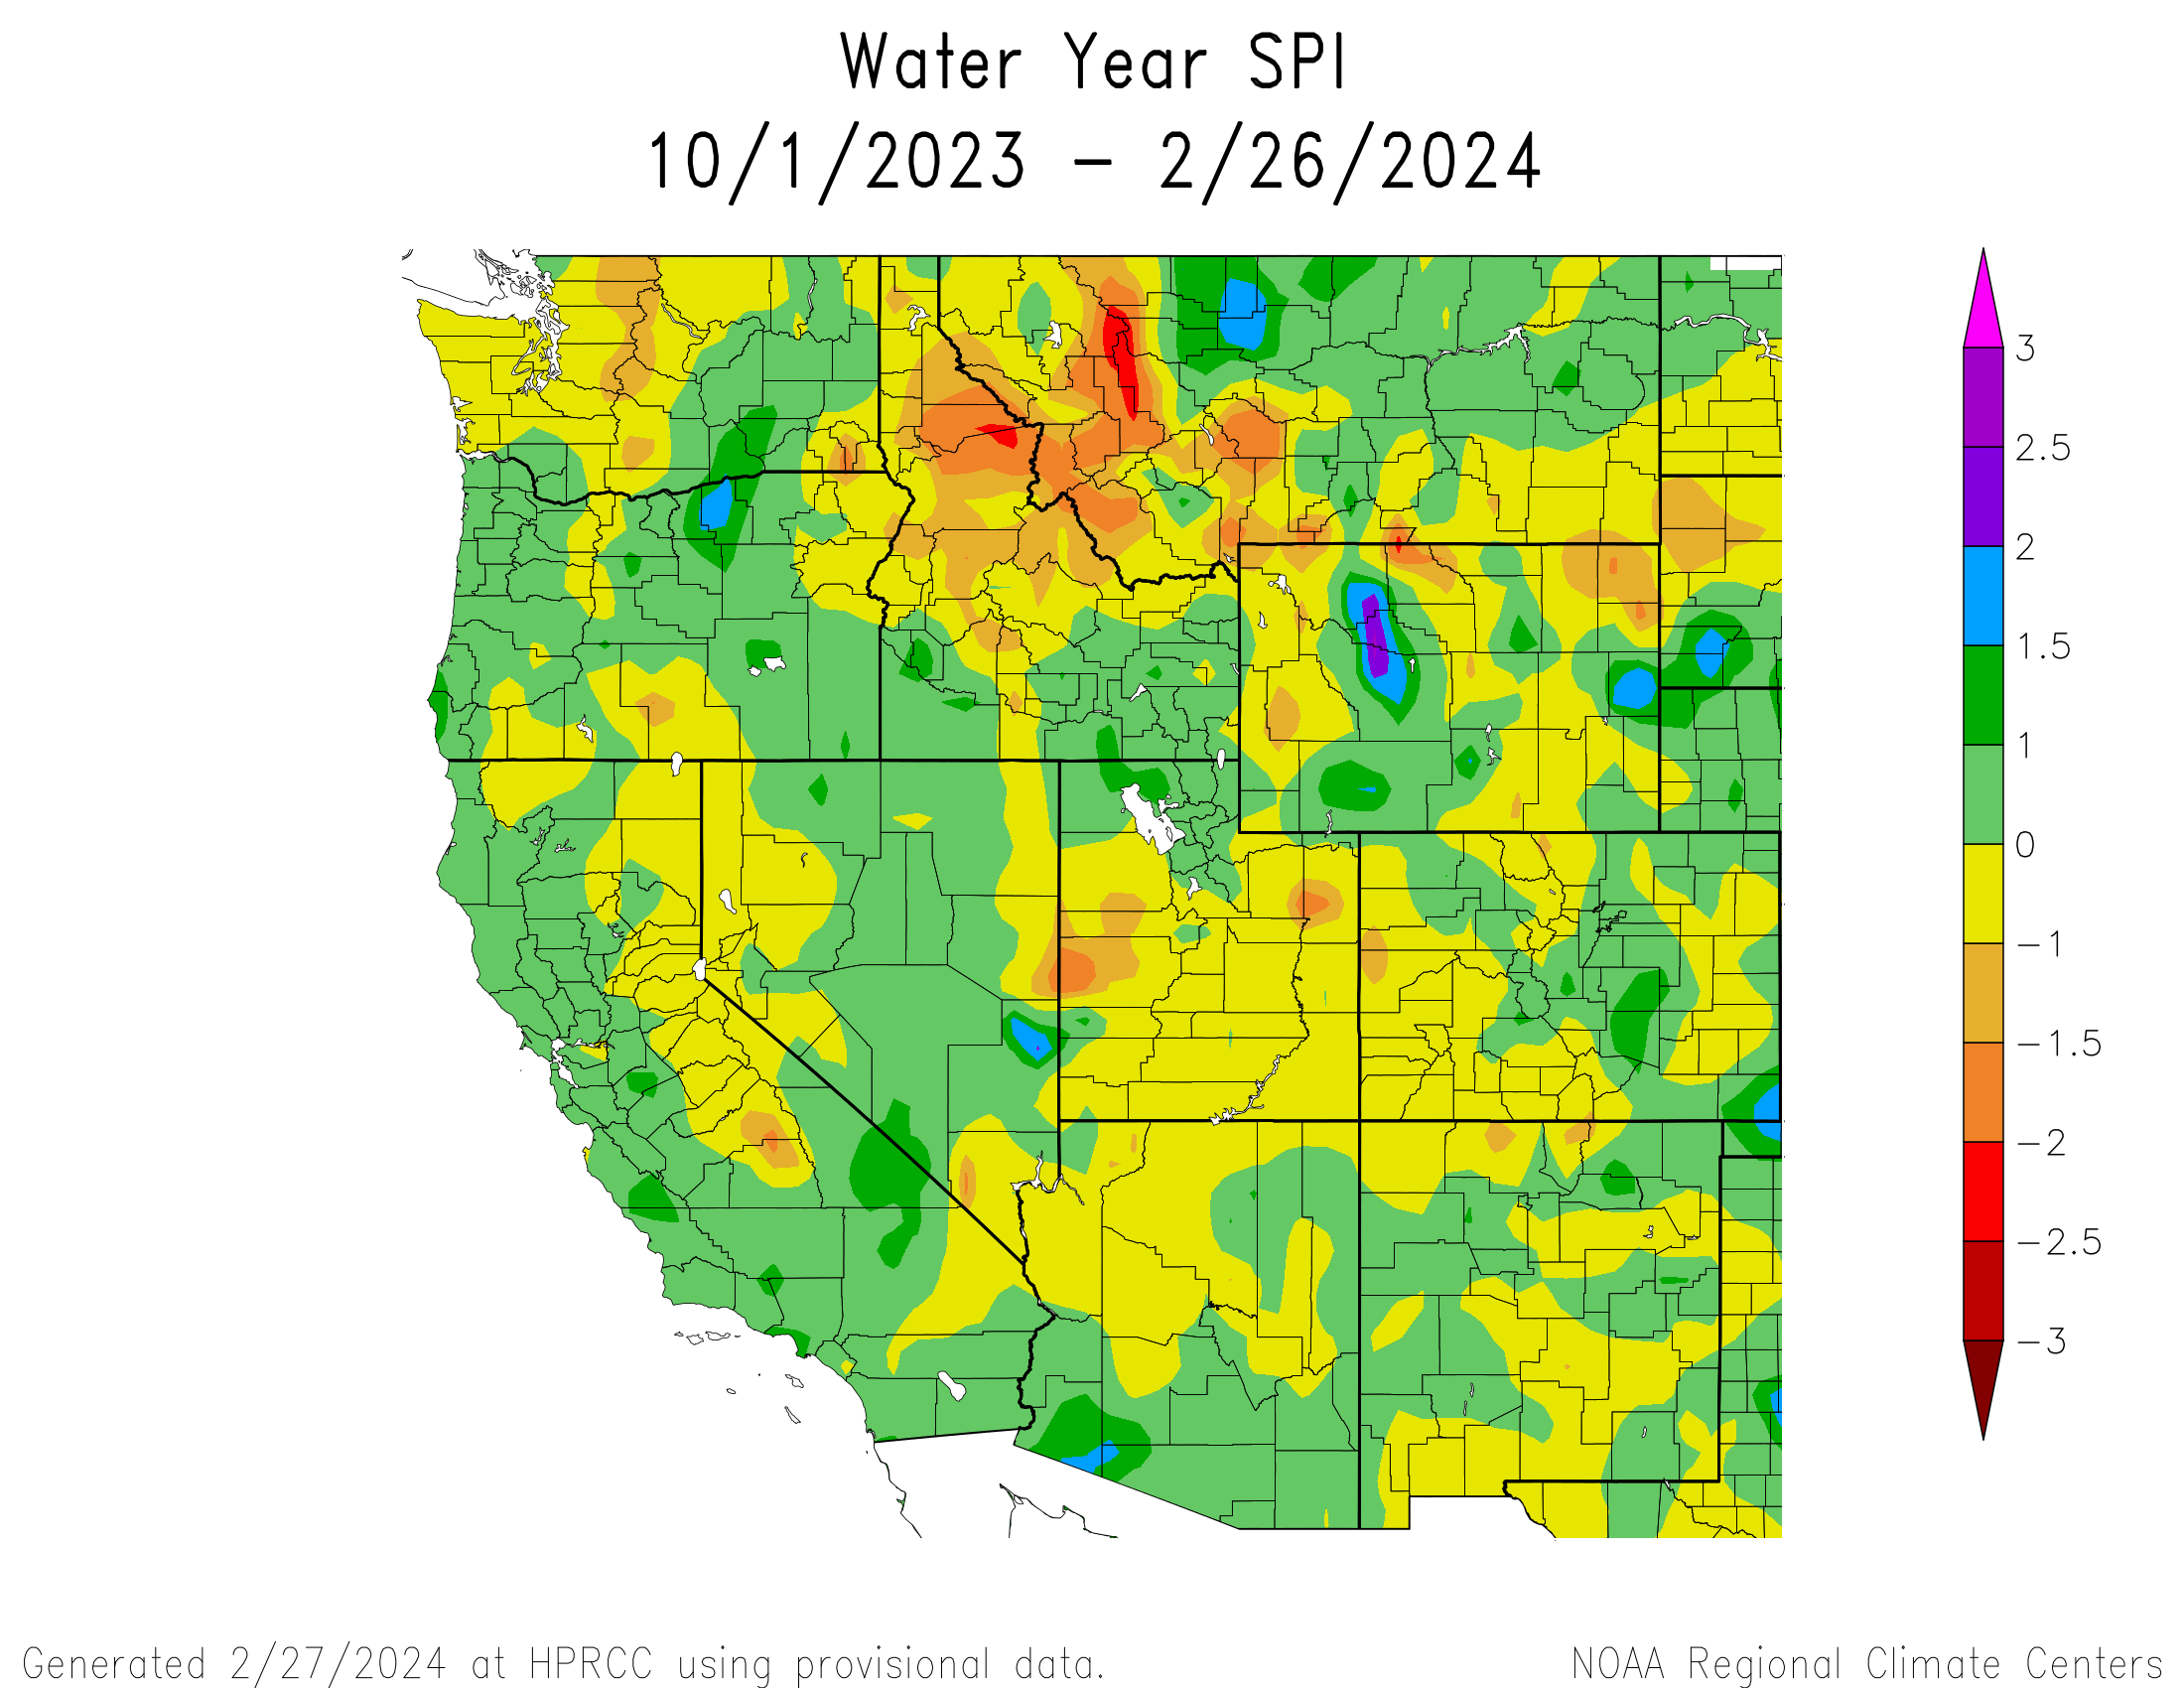
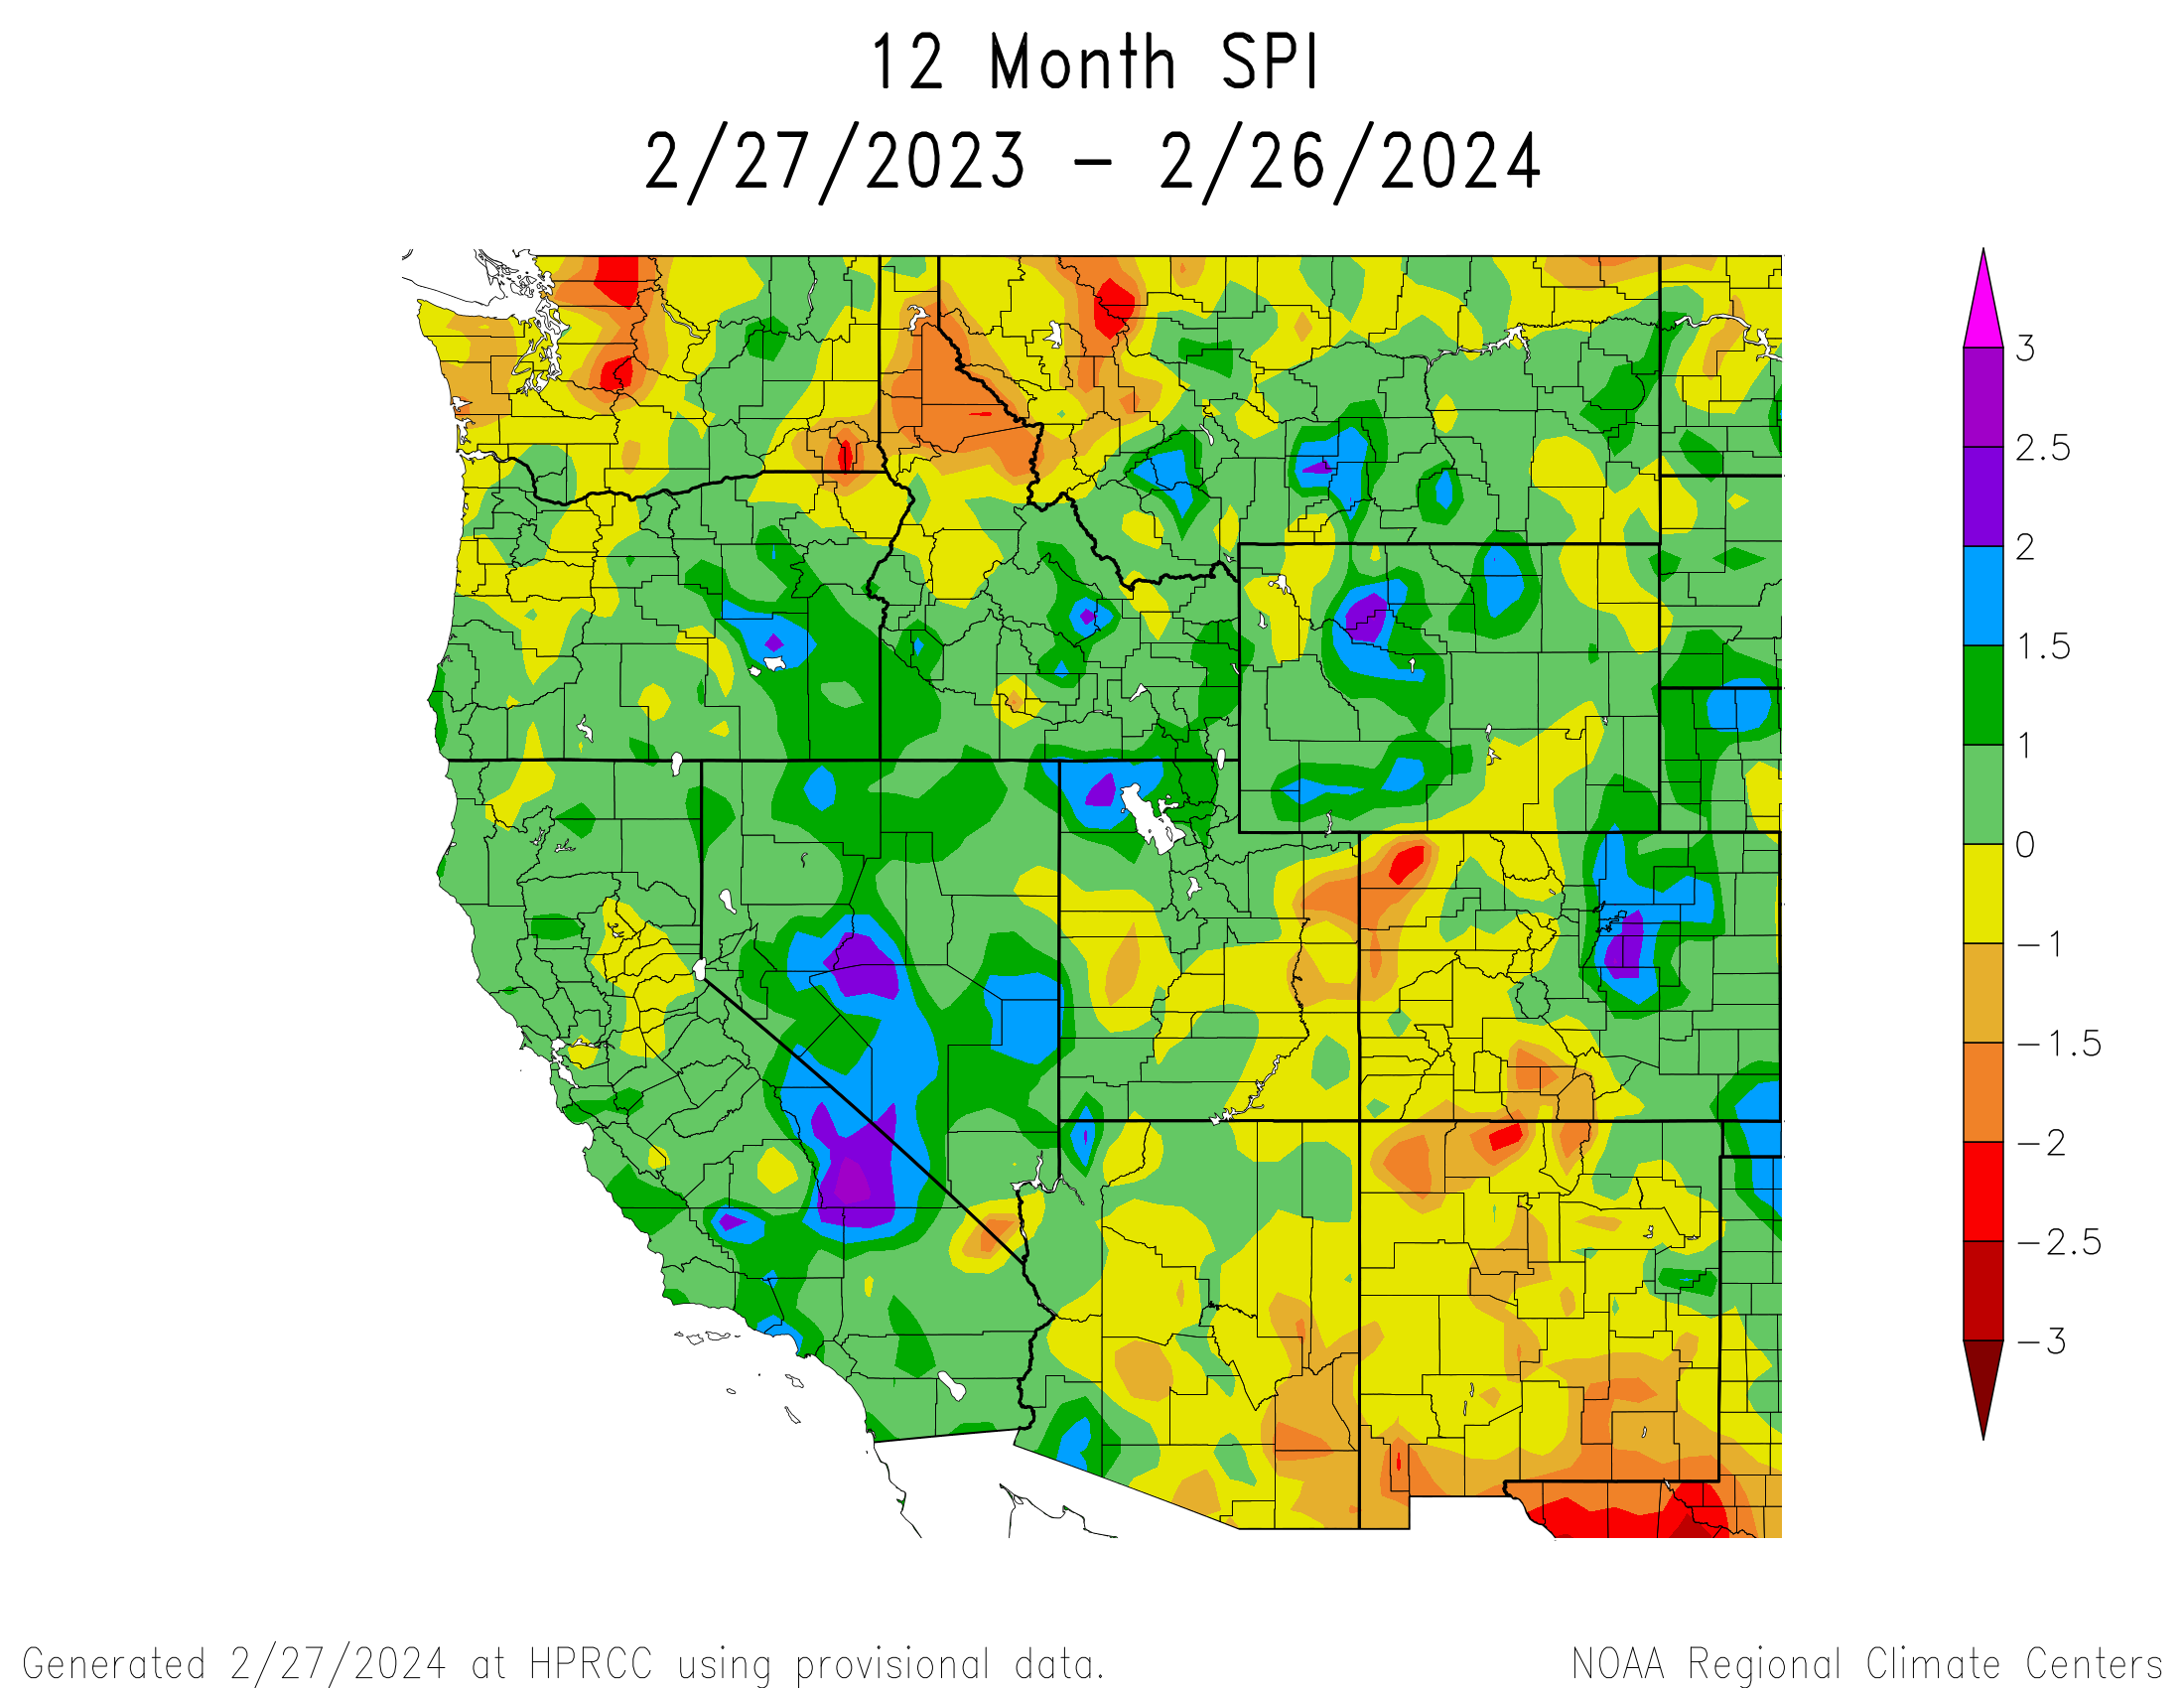
Standardized Precipitation Index (SPI)
Updated daily. Standardized Precipitation Index (SPI) is a
probability index that considers only precipitation. The SPI is an index
based on the probability of recording a given amount of precipitation,
and the probabilities are standardized so that an index of zero indicates
the median precipitation amount (half of the historical precipitation
amounts are below the median, and half are above the median). The index
is negative for drought, and positive for wet conditions.
| Last 30 days | Last 60 days | Last 90 days |
Water Year (since Oct 1) |
Last 12 months |
|---|---|---|---|---|
|
|
|
|
|
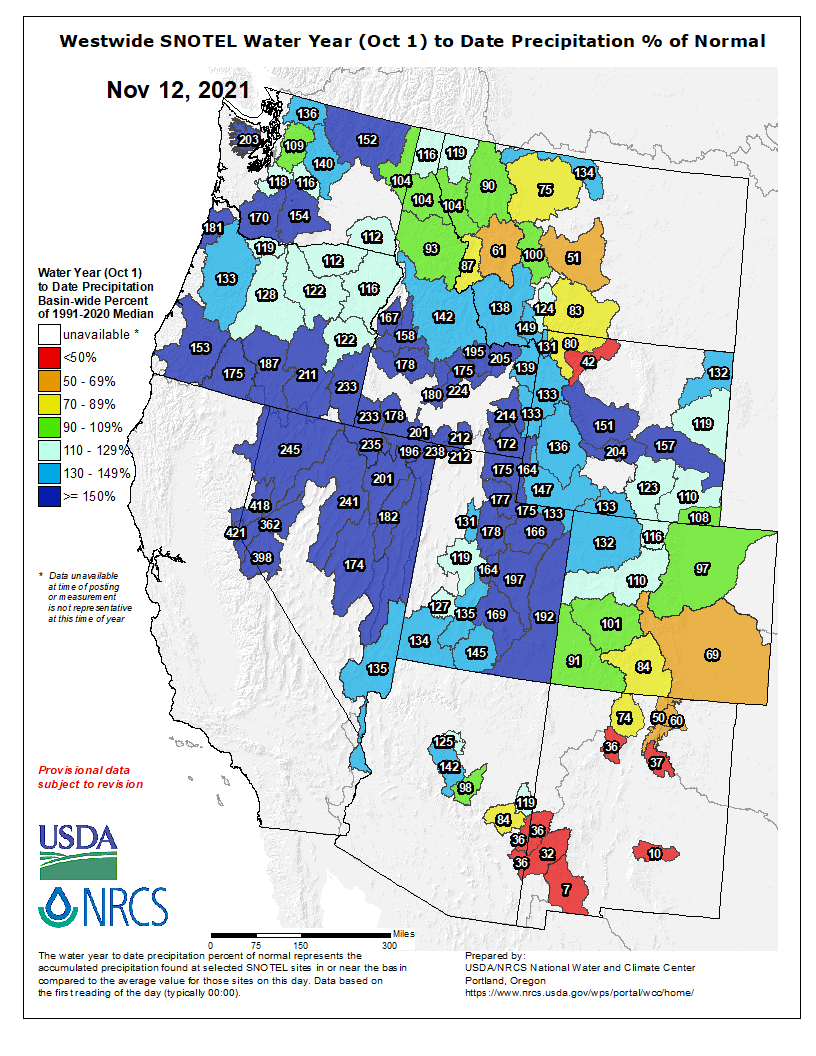
NRCS Snotel Basin Graphics
|
WY to Date Precipitation % of Normal
Percent of 1981-2010 average precipitation by basin for the water year
to date. Updated daily.
|
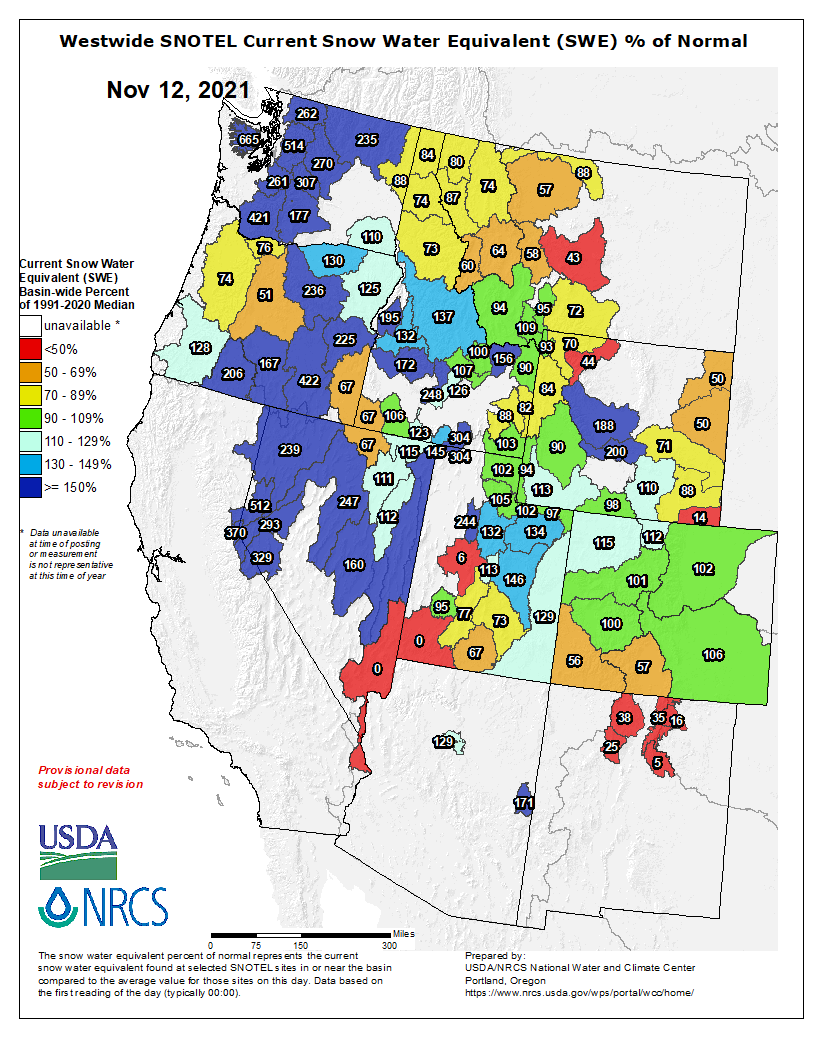
Current % of Normal
Snow Water Equiv.
Snow water equivalent (SWE) percent of normal by basin based on
1981-2010 average. This product is updated daily with data
from NRCS SNOTEL stations, and may not have data available in some
locations in the summer and fall months.
|
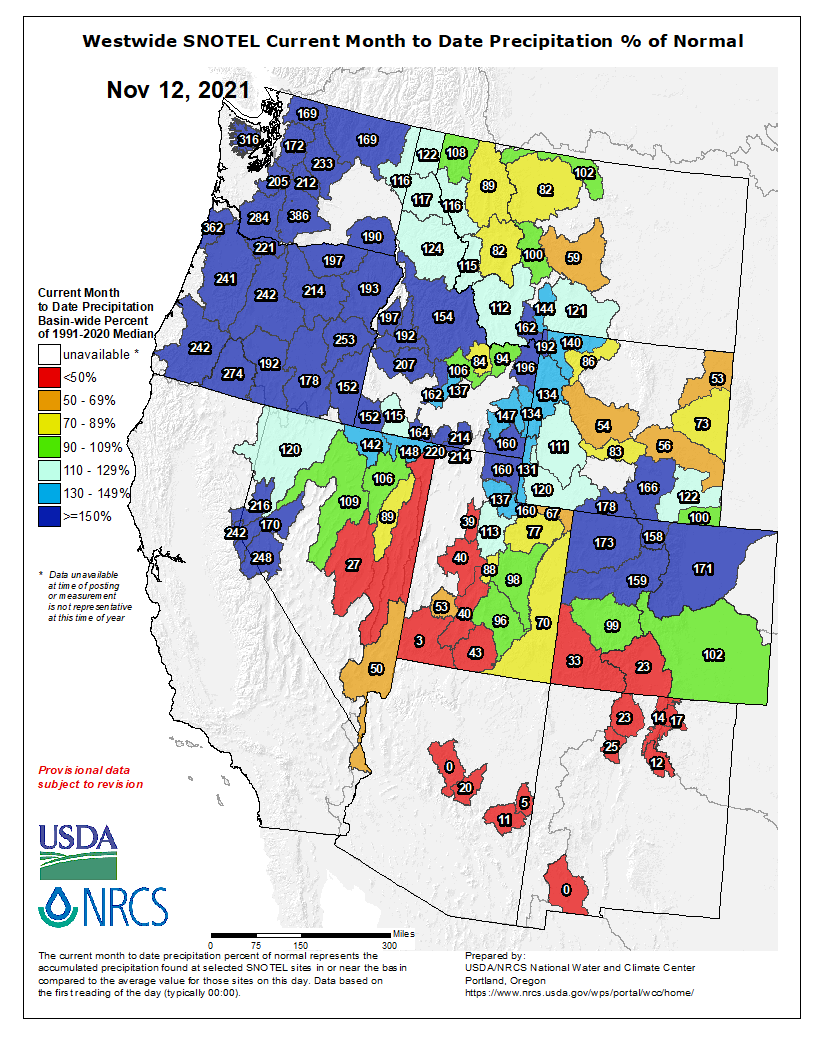
Month to Date % of
Normal Precipitation
Precipitation percent of normal by basin based on 1981-2010 average.
This product is updated daily with data from NRCS SNOTEL
stations.
|
|---|---|---|
|
|
|
Links:
NRCS Snotel GIS Products
Other Hydrologic Information
|
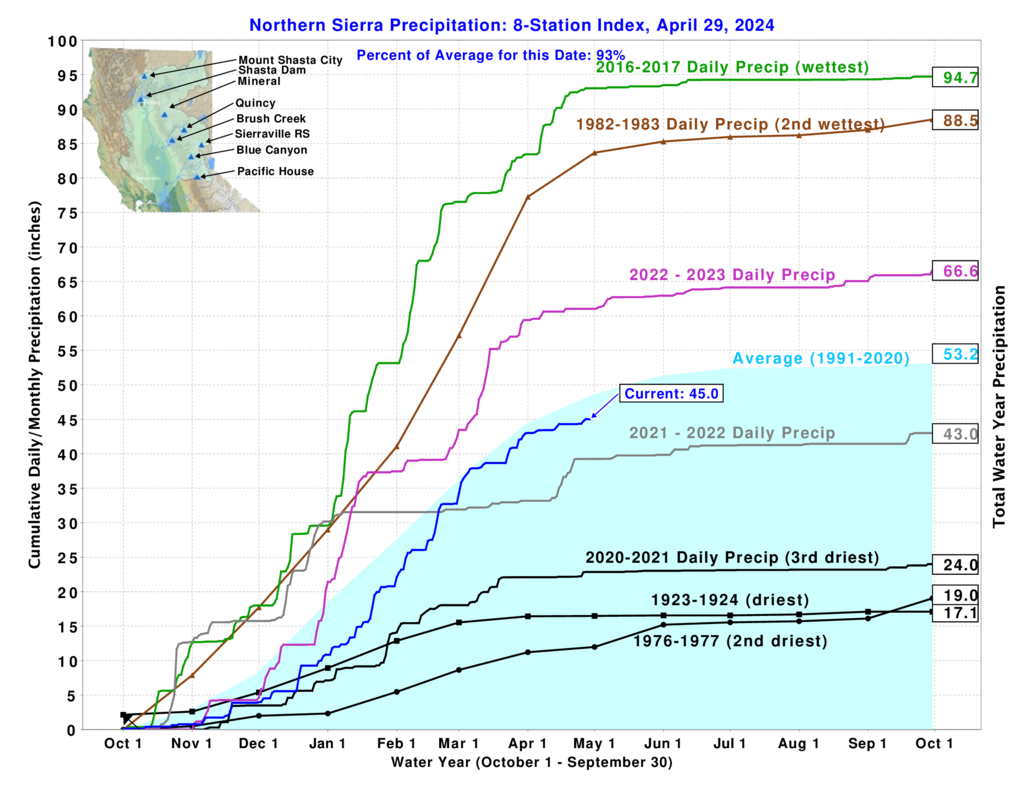
N. Sierra 8-Station
Cumulative Precip.
Updated daily. Cumulative precipitation for northern Sierra
8-Station Index for current water year, past two water years, average,
two driest years and wettest year on record.
|
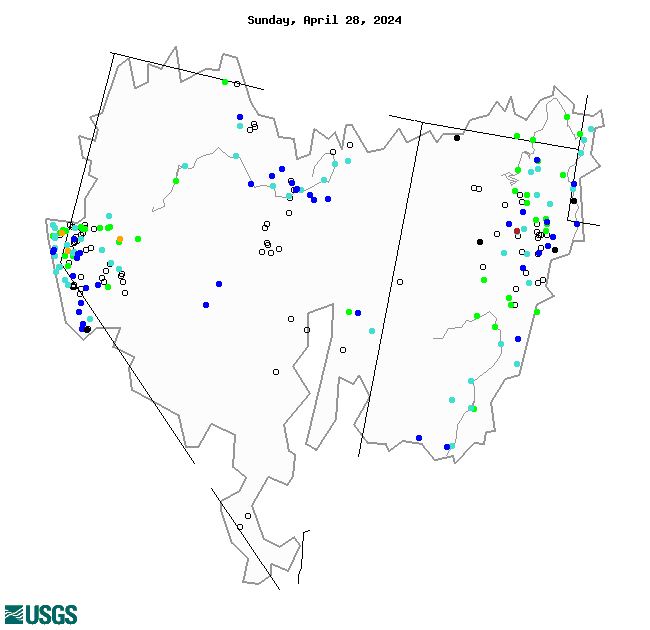
Real-Time
Streamflow
Real time. This map shows real-time stream flow in the Great
Basin. Yellow to red shades represent below normal stream flow, with
bright red less than 10th percentile. Green shows normal flow in the
25-75th percentile. Shades of blue indicate above normal, and black
represents the highest flows, greater than 90th percentile. This
real-time stream flow map is meant to highlight flood and high flow
conditions.
|
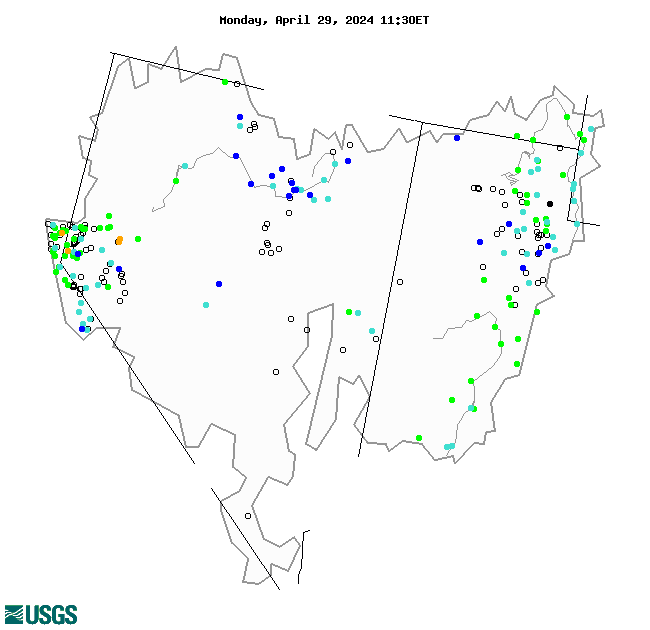
7-day Average
Streamflow
Updated daily. This map shows 7-day average stream flow in the
Great Basin. Yellow to red shades represent below normal stream flow,
with bright red less than 10th percentile. Green shows normal flow in
the 25-75th percentile. Shades of blue indicate above normal, and
black represents the highest flows, greater than 90th percentile. The
7-day stream flow map is used to highlight below-normal and drought
conditions, rather than flood conditions.
|
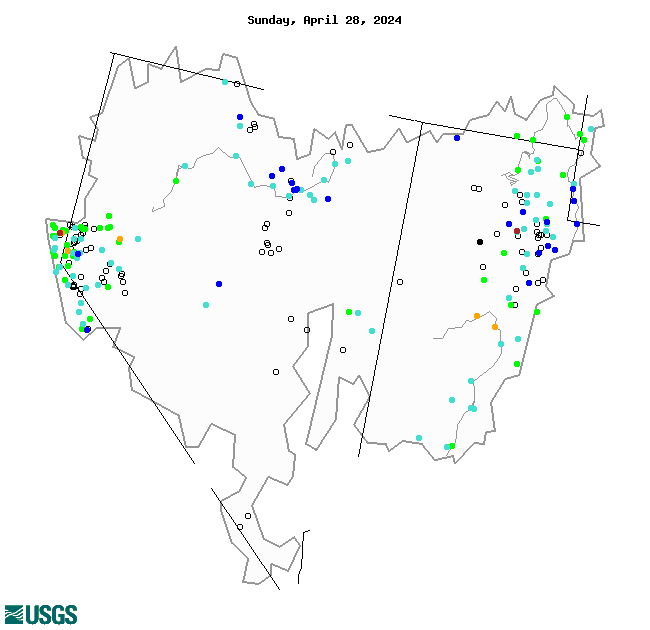
28-day Average
Streamflow
Updated daily. This map shows average stream flow for the past
28 days in the Great Basin. Yellow to red shades represent below
normal stream flow, with bright red less than 10th percentile. Green
shows normal flow in the 25-75th percentile. Shades of blue indicate
above normal, and black represents the highest flows, greater than
90th percentile. The 28-day stream flow map is used to highlight
below-normal and drought conditions, rather than flood conditions.
|
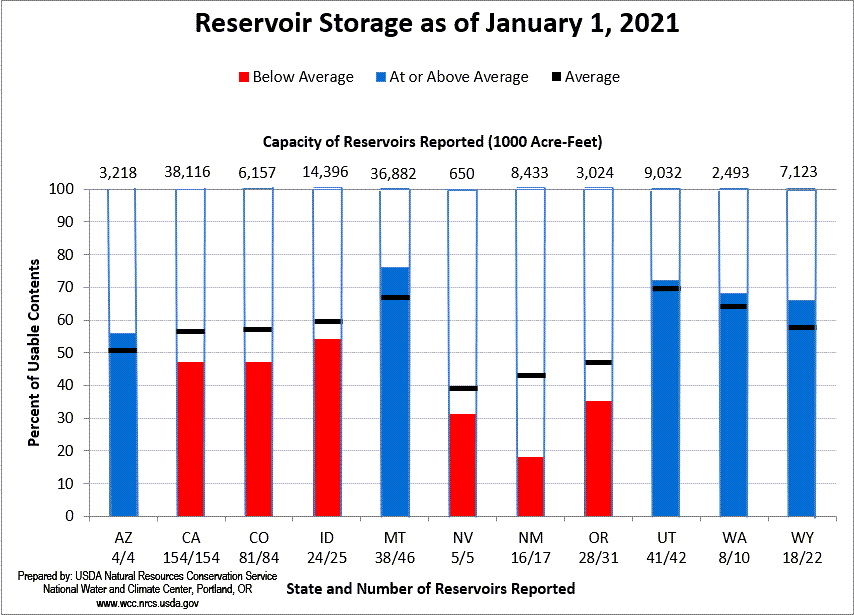
Reservoir
Storage
Updated by 10th of each month. This graph from NRCS shows
monthly reservoir storage as compared to capacity and average for
states in the western US. The graph is updated each month January-May.
|
|---|---|---|---|---|
|
|
|
|
|
Links:
CDEC Sierra Precipitation
|
USGS Water Watch
|
About Waterwatch
|
NRCS Reservoir Info/Graphics
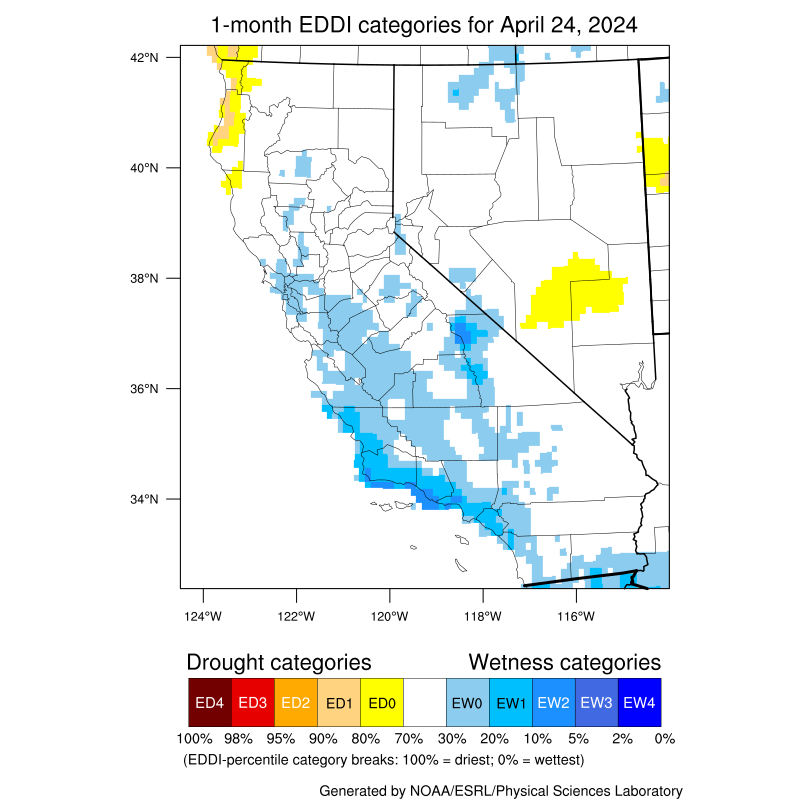
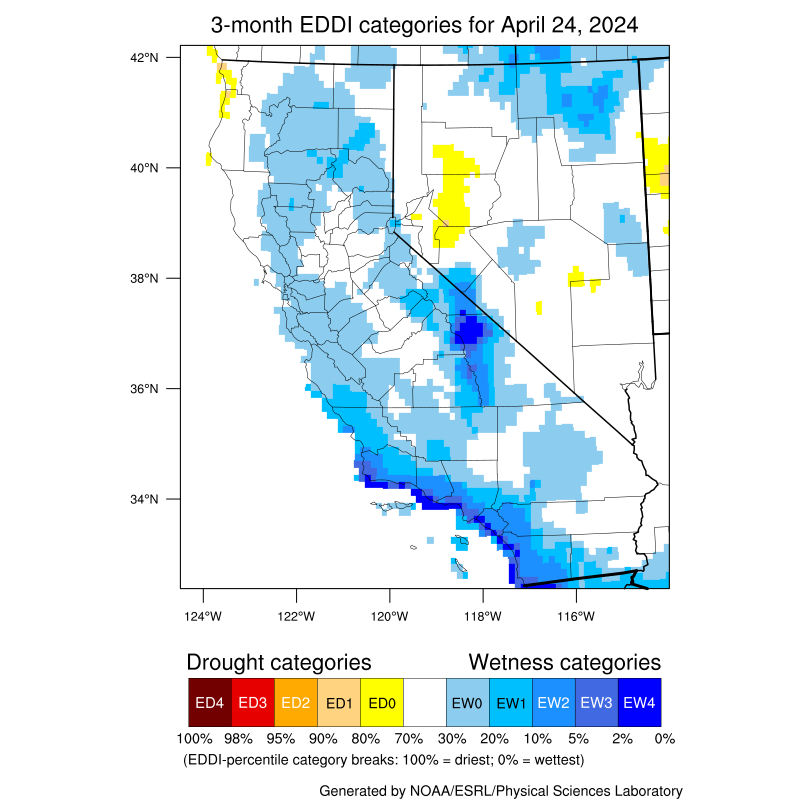
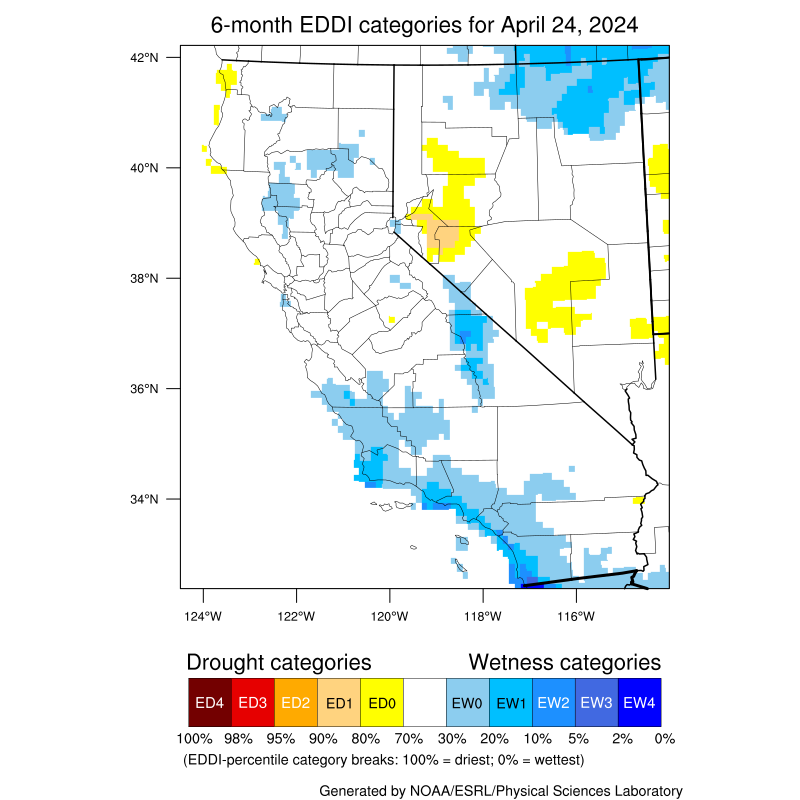
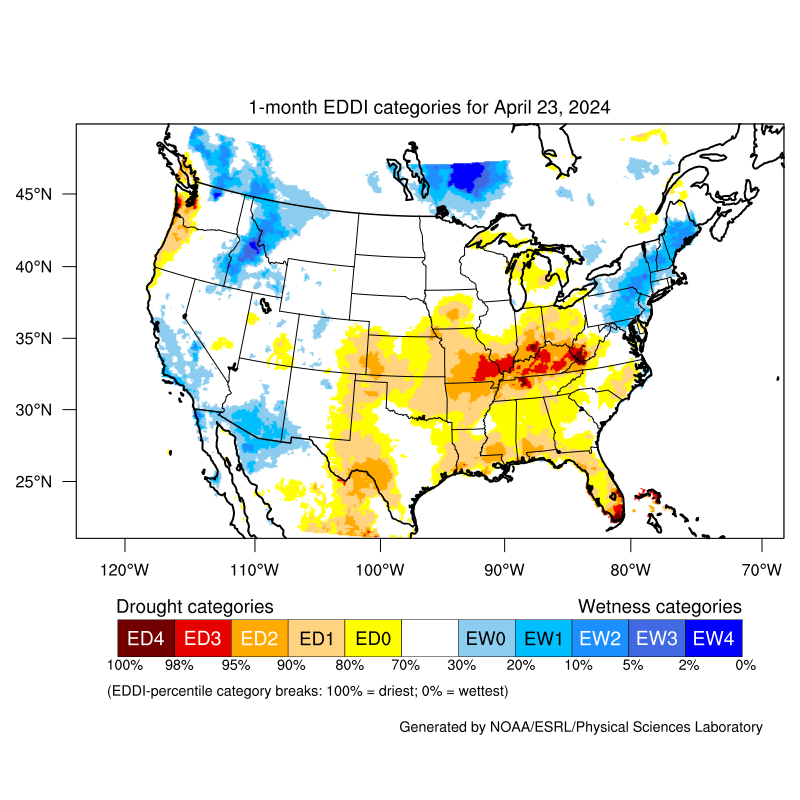
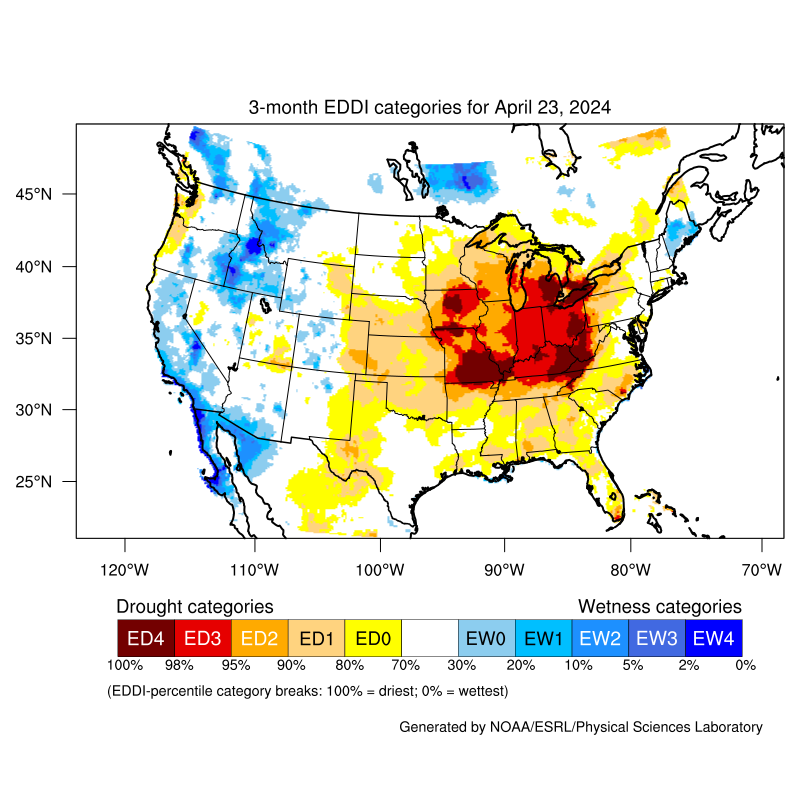
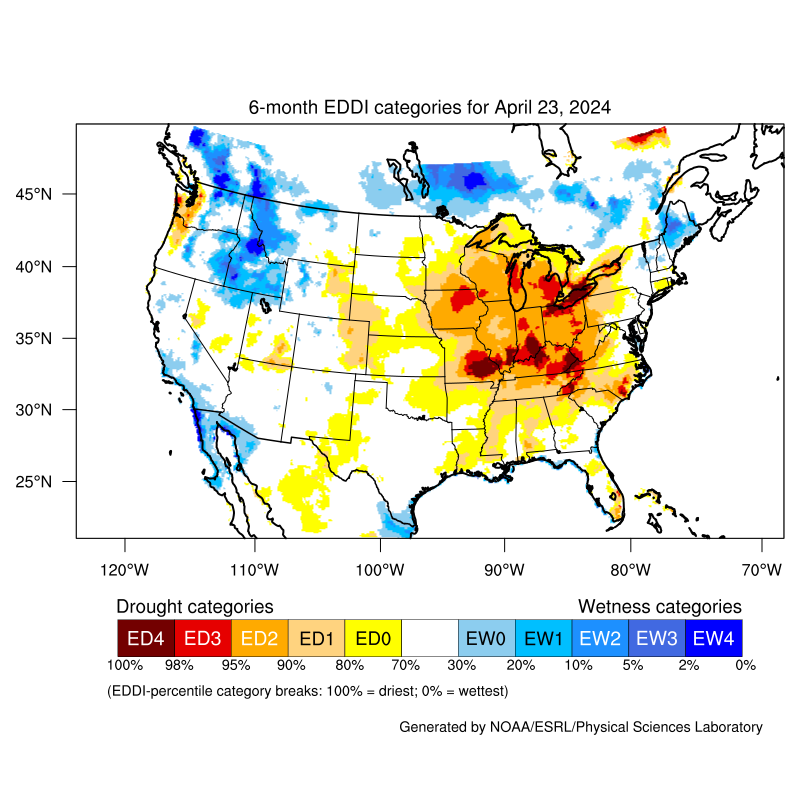
CA-NV Evaporative Demand Drought Index (EDDI) Current Analyses
Updated daily. The EDDI examines how anomalous the atmospheric
evaporative demand (also known as "the thirst of the atmosphere") is for
a given location and across a time period of interest. EDDI is calculated
based on NLDAS 1/8-degree gridded meteorological data and shown here for
one, three, and six month periods. EDDI is updated daily, with a
five-day lag.
| 1-Month EDDI | 3-Month EDDI | 6-Month EDDI |
|---|---|---|
|
|
|
Links:
ESRL EDDI Information
US-Wide Evaporative Demand Drought Index (EDDI) Current Analyses
Updated daily. The EDDI examines how anomalous the atmospheric
evaporative demand (also known as "the thirst of the atmosphere") is for
a given location and across a time period of interest. EDDI is calculated
based on NLDAS 1/8-degree gridded meteorological data and shown here for
one, three, and six month periods. EDDI is updated daily, with a
five-day lag.
| 1-Month EDDI | 3-Month EDDI | 6-Month EDDI |
|---|---|---|
|
|
|
Links:
ESRL EDDI Information
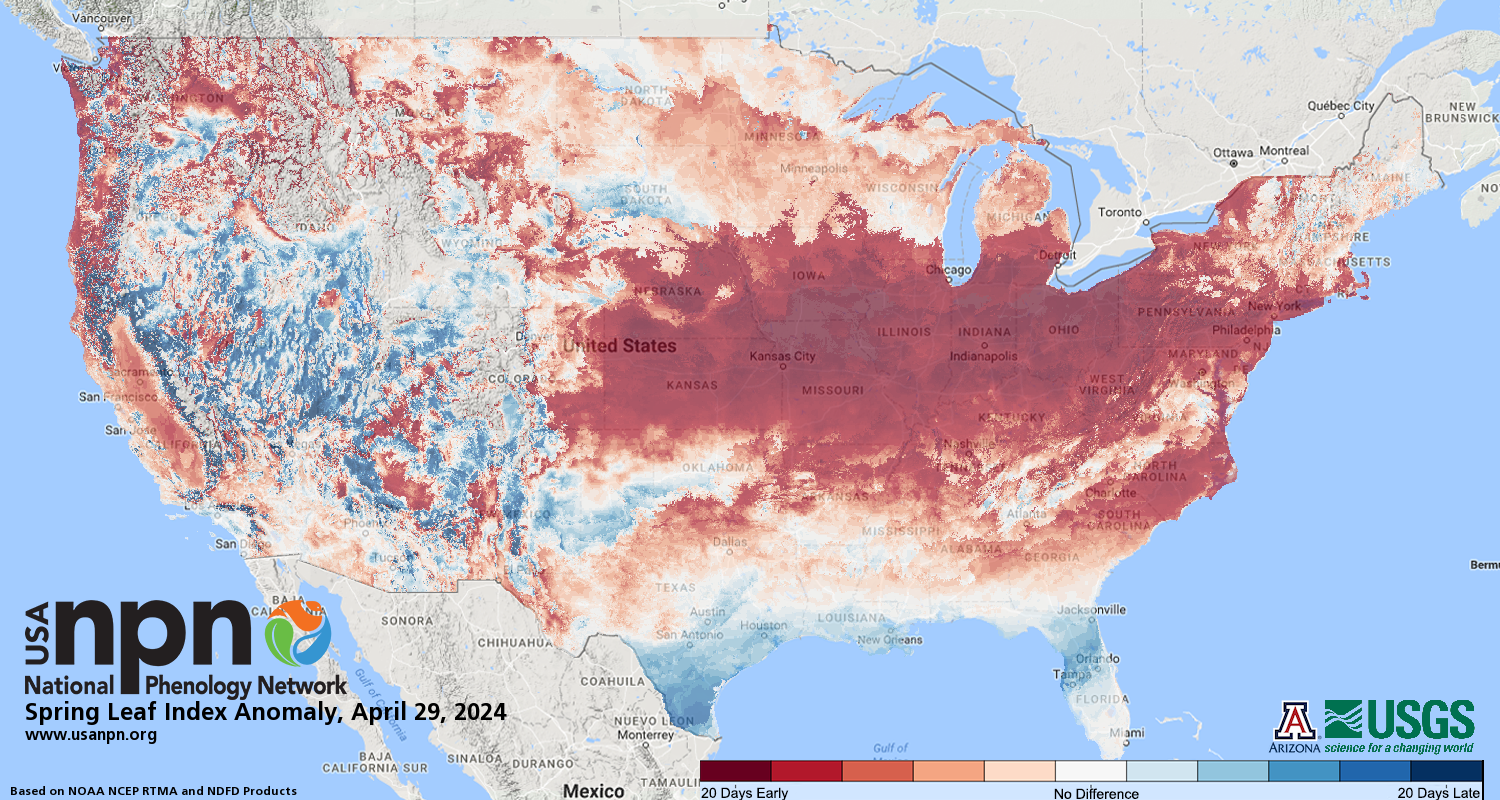
National Phenology Network
|
Spring Leaf
Index Anomaly
The First Leaf Index is based on the leaf-out of lilacs and
honeysuckles, which are among the first plants to show their leaves
in the spring. This Index is associated with the first leafing of
early-spring shrubs and other plants. The anomaly maps indicate how a
particular season "leaf-out" compares to an historic period
(1982-2010).
|
|---|
|
Links:
National Phenology Network