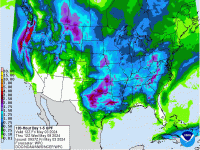
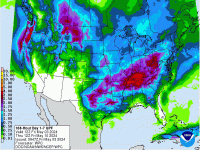
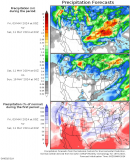
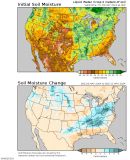
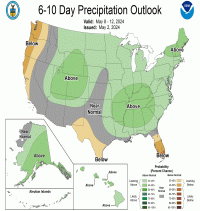
Medium Range (3-7 Day) Precipitation and Soil Moisture Forecasts
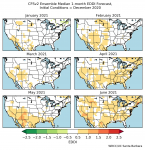
Evaporative Demand Drought Index (EDDI) Projections
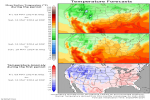
Medium Range (3-7 Day) Temperature Forecasts
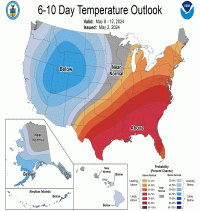
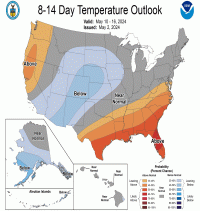
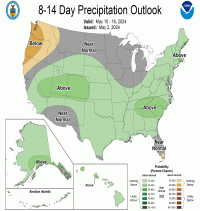
Climate Prediction Center Short-Term Temperature and Precipitation Outlooks
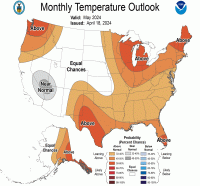
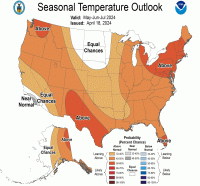
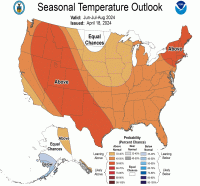
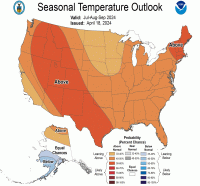
Climate Prediction Center Long-Term Temperature Outlooks

Updated 3rd week of each month. These maps display the
probability of having temperatures that are above (A), below (B), or
normal (N), as compared to the 1981-2010 30-year climatological norm
for an area. A is based on the 10 warmest years, B on the 10 colest
years, and N on the other years of the period. Orange-red colors
indicate probabilities of above normal temperatures, while blue colors
indicate probabilities of below normal temperatures.
|
1 Month Outlook
From Current Month |
3 Month Outlook
From Current Month |
Months 2-4 Outlook
From Current Month |
Months 3-5 Outlook
From Current Month |
|---|---|---|---|
|
|
|
|
Links:
CPC Seasonal Forecasts
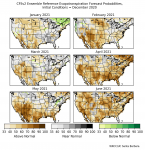
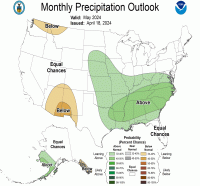
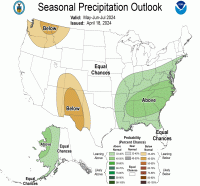
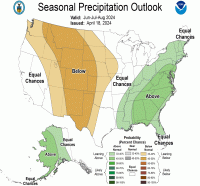
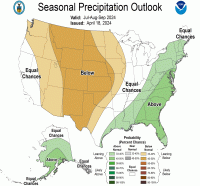
Climate Prediction Center Long-Term Precipitation Outlooks

Updated 3rd week of each month. These maps display the
probability of having precipitation that is above (A), below (B), or
normal (N), as compared to the 1981-2010 30-year climatological norm
for an area. A is based on the 10 wettest years, B on the 10 driest
years, and N on the middle years. Green colors indicate probabilities
of above normal, while brown colors indicate probabilities below
normal.
|
1 Month Outlook
From Current Month |
3 Month Outlook
From Current Month |
Months 2-4 Outlook
From Current Month |
Months 3-5 Outlook
From Current Month |
|---|---|---|---|
|
|
|
|
Links:
CPC Seasonal Forecasts
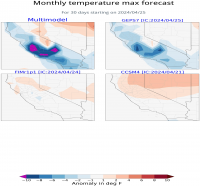
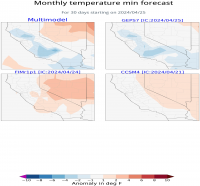
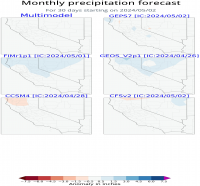
30-Day North American Multimodel Subseasonal forecast project (NMME SubX)

Updated weekly each Thursday. Forecast anomaly over the next 30 days based on multiple climate models.
Anomaly is calculated relative to each model's own historical forecast climatology which consists of forecasts
made for the target period during 1999-2016. Forecast data are obtained from the North American Multimodel
Subseasonal forecast project (NMME SubX). This map gets updated every Thursday.
| Maximum Temperature | Minimum Temperature | Precipitation |
|---|---|---|
|
|
|
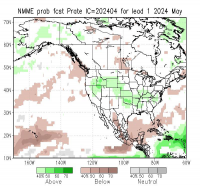
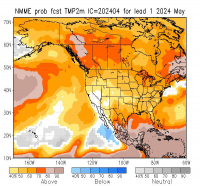
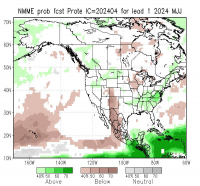
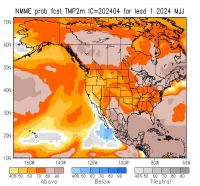
National Multi-Model Ensemble *Experimental* Forecasts (NMME)

Updated monthly. Experimental multi-model temperature and
precipitation forecasts from NOAA Climate Prediction Center.
|
1-Month Probabilistic
Precipitation |
1-Month Probabilistic
Temperature |
3-Month Probabilistic
Precipitation |
3-Month Probabilistic
Temperature |
|---|---|---|---|
|
|
|
|
Significant Wildland Fire Potential Outlook

Updated first of each month. Outlooks for current month,
following month, and two months beyond that. These assessments are
designed to inform decision makers for proactive wildland fire
management, thus better protecting lives and property, reducing
firefighting costs and improving firefighting efficiency. The following
maps represent the cumulative forecasts of the eleven Geographic Area
Predictive Services Units and the National Predictive Services Unit.
| Current Month Outlook | 1 Month Outlook | 2 Month Outlook |
|---|---|---|

|

|

|
Links:
Predictive Services Outlooks
Streamflow Forecasts

