
Medium Range (3-7 Day) Precipitation and Soil Moisture Forecasts
|
5-day Quantitative
Precipitation Forecast
Updated daily. This image from the Weather Prediction
Center shows the quantity of precipitation in inches forecast to
fall over a 5-day period beginning at 00Z (5 pm PDT) on the
current day.
|
7-day Quantitative
Precipitation Forecast
Updated daily. This *experimental* product from the Weather
Prediction Center shows the quantity of precipitation in inches
forecast to fall over a 7-day period beginning at 00Z (5 pm PDT)
on the current day.
|
7-day QPF
and Anomaly
Updated daily. These images are produced by COLA/IGES using
NCEP forecast data. The top image shows the quantity of accumulated
precipitation in inches expected over the next 7 days starting at
12Z on the current day. The middle image shows accumulated
precipitation for days 8-14. The bottom image shows the departure
of the first 7-day accumulation from the CMAP 25-year climatology.
|
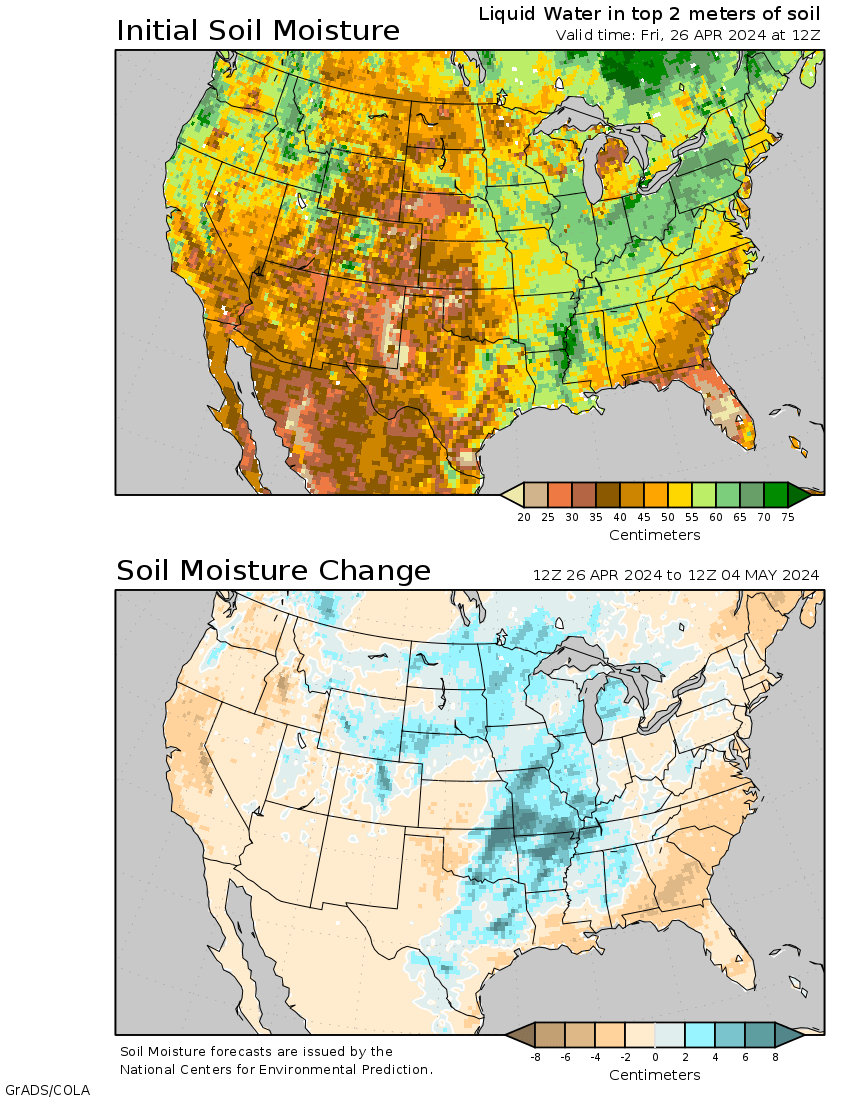
Current Soil Moisture
and Forecast Change
Updated daily. These images are produced by COLA/IGES using
NCEP forecast data. The top image shows current soil moisture
conditions – liquid water in cm in the top 2 meters of soil.
The bottom image shows the forecasted change in soil moisture over
the next 7 days.
|
|---|---|---|---|
|
|

|
|
Evaporative Demand Drought Index (EDDI) Projections
|
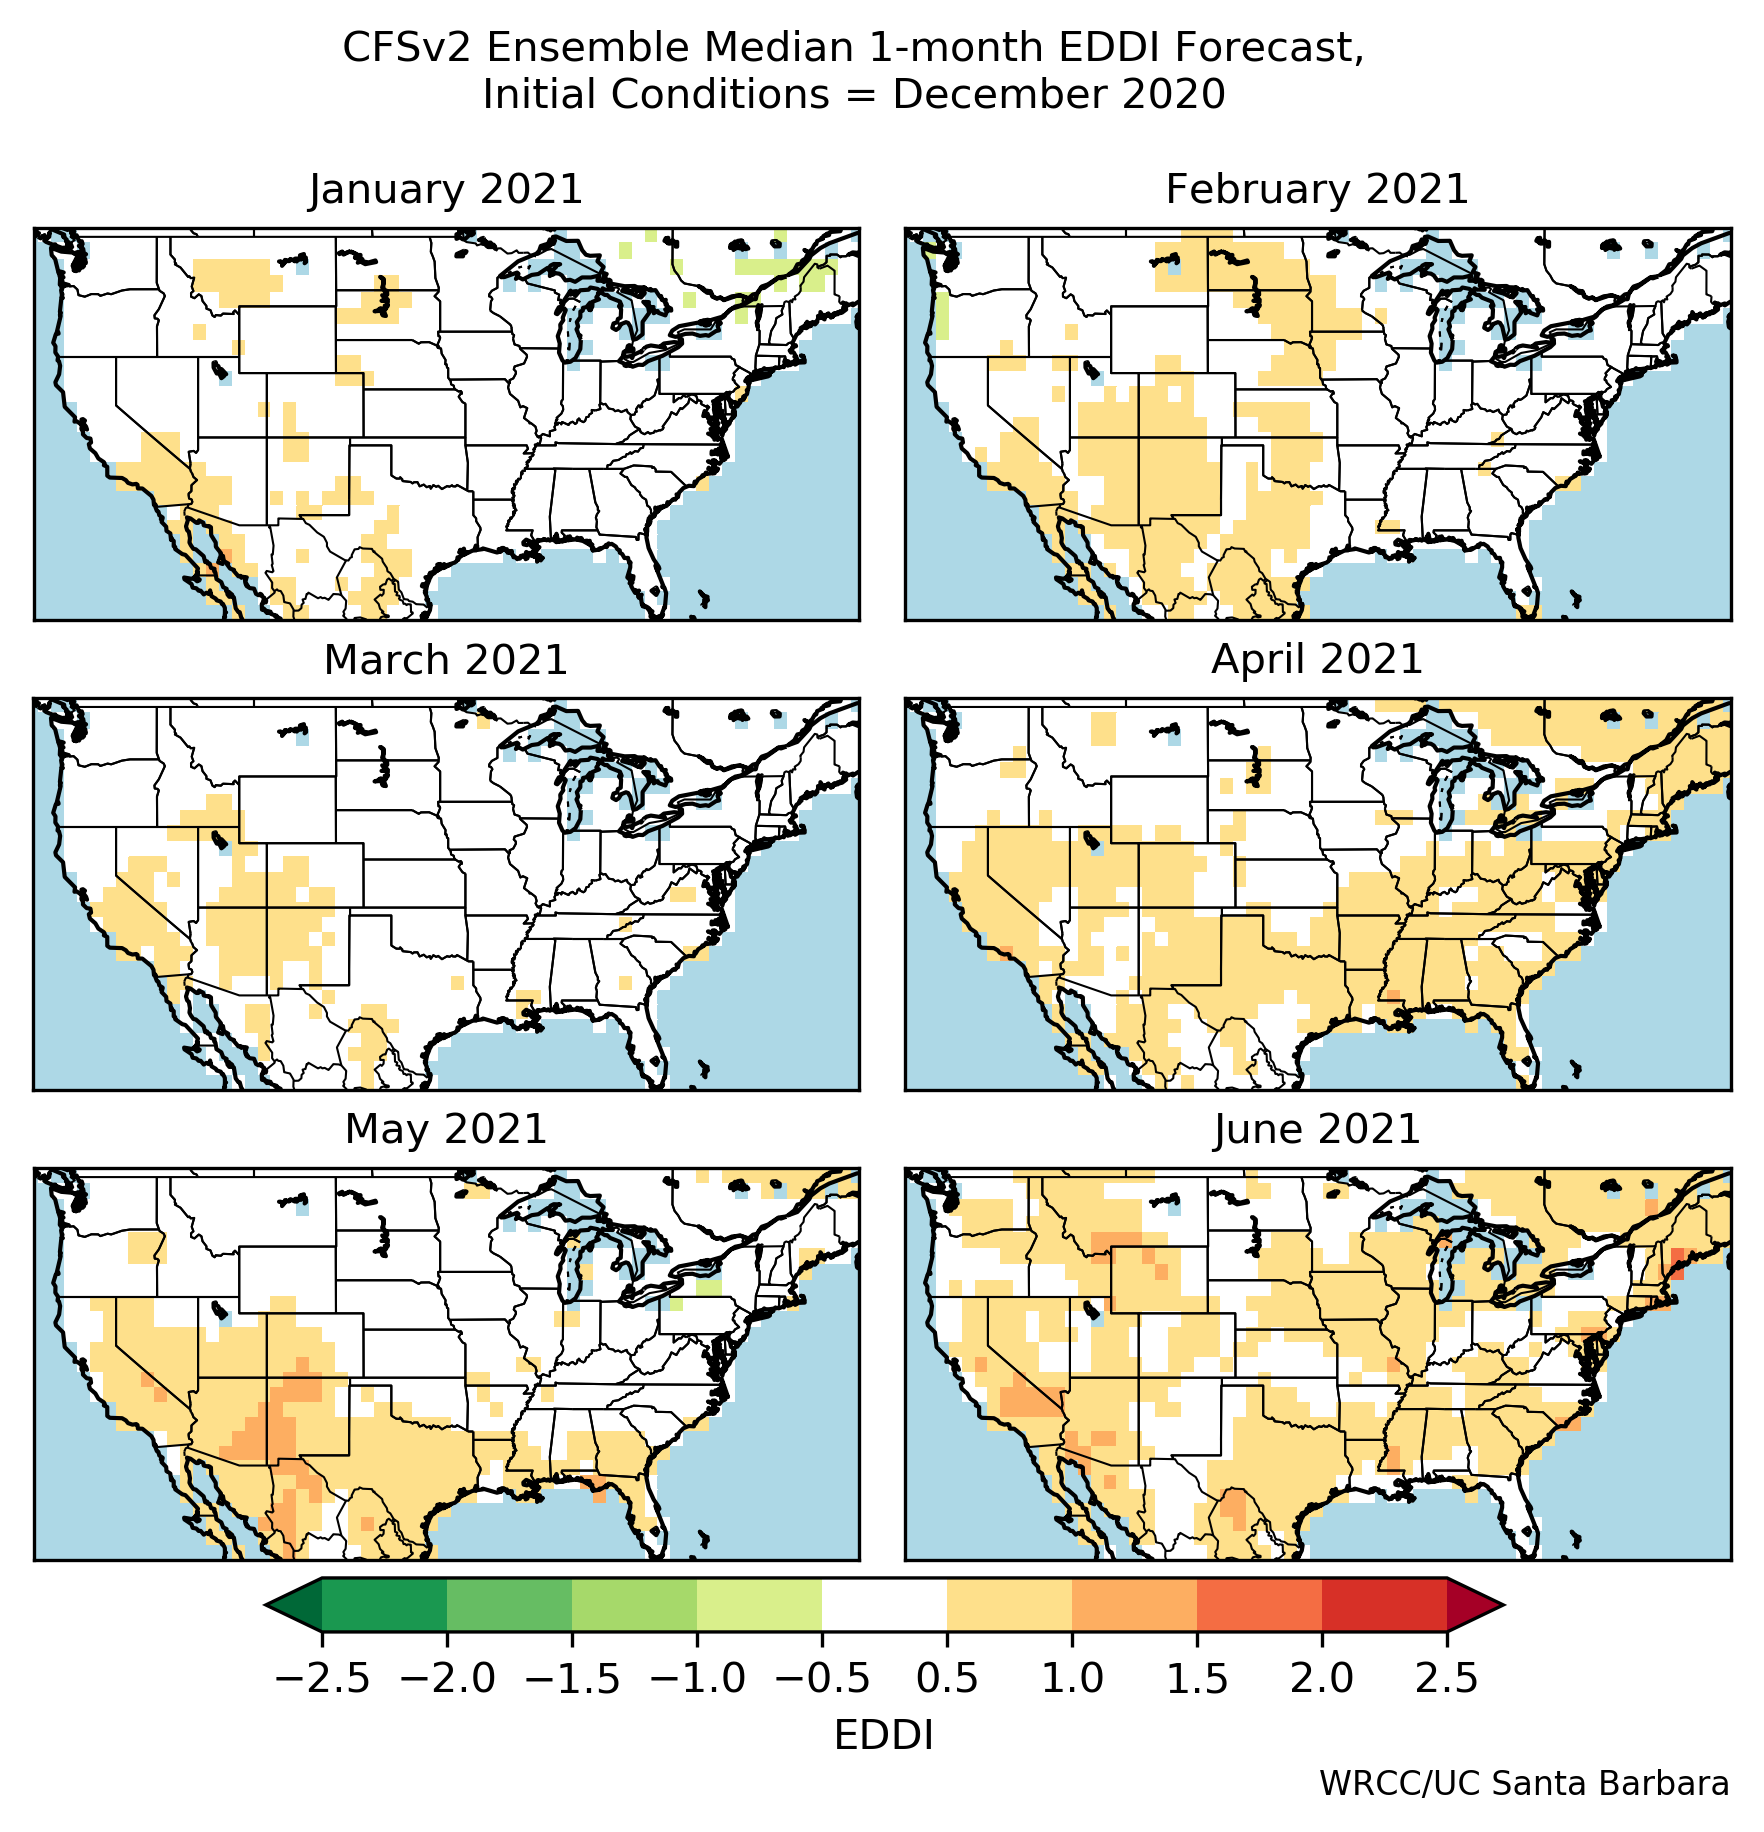
EDDI Forecast for
6-Month Period
Updated monthly. EDDI examines how anomalous the atmospheric
evaporative demand (also known as "the thirst of the atmosphere")
is for a given location and across a time period of interest. This
figure provides the projected median EDDI value based on the 20 to
28-member CFSv2 forecast model ensemble output. Figures are updated
on the 3rd of each month. The first and second months of the
forecast are likely to have the highest skill, though data are
provided out six months for consideration.
|
Evaporative Demand Probabilistic
Forecast for 6-Month Period
Updated monthly. This figure describes the likelihood of
near, above, or below normal evaporative demand values based on the
20 to 28-member CFSv2 forecast model output. Figures are updated on
the 3rd of each month. The first and second months of the forecast
are likely to have the highest skill, though data are provided out
six months for consideration.
|
|---|---|
|

|
Medium Range (3-7 Day) Temperature Forecasts
|
Day 1-5 Minimum
Temperature Anomaly
Updated daily. This image from the Weather Prediction Center
shows the mean minimum temperature anomaly for a 5-day period
beginning at 00Z (5 pm PDT) on the current day. The anomaly is
based off the GFS Model Output Statistics (MOS) climatology.
|
Day 1-5 Maximum
Temperature Anomaly
Updated daily. This image from the Weather Prediction Center
shows the mean maximum temperature anomaly for a 5-day period
beginning at 00Z (5 pm PDT) on the current day. The anomaly is
based off the GFS Model Output Statistics (MOS) climatology.
|
Day 3-7 Minimum
Temperature Anomaly
Updated daily.This image from the Weather Prediction Center
shows the mean minimum temperature anomaly for days 3-7 out from
00Z (5 pm PDT) on the current day. The forecasts are created using
WPC medium-range forecast guidance.
|
Day 3-7 Maximum
Temperature Anomaly
Updated daily. This image from the Weather Prediction Center
shows the mean maximum temperature anomaly for days 3-7 out from
00Z (5 pm PDT) on the current day. The forecasts are created using
WPC medium-range forecast guidance.
|
7-day Mean
Surface Temperature and Anomaly
Updated daily.These images are produced by COLA/IGES using
NCEP forecast data. The top image shows the mean surface
temperature over the next 7 days starting at 12Z on the current
day. The middle image shows mean surface temperature for days 8-14.
The bottom image shows the departure of the first 7-day mean
temperature from the CRU 100-year climatology.
|
|---|---|---|---|---|

|

|
|
|

|
Climate Prediction Center Short-Term Temperature and Precipitation Outlooks
|
6-10 Day Temperature
Outlook
Updated daily. The 6-10 day outlooks give the confidence that
a forecaster has, given as probability, that the observed
temperature (averaged over the time period of 6-10 days) will be in
the range of one of three possible categories. These are below (B),
normal (N), or above (A) the 1981-2010 climatological norm for a
given area. Blue colors indicate below normal, orange-red colors
indicate above. Darker shading indicates a higher level of
confidence.
|
6-10 Day Precipitation
Outlook
Updated daily. The 6-10 day outlooks give the confidence that
a forecaster has, given as probability, that the observed
precipitation (averaged over the time period of 6-10 days) will be
in the range of one of three possible categories. These are below
(B), normal (N), or above (A) the 1981-2010 climatological norm for
a given area. Brown colors indicate below normal, green colors
indicate above. Darker shading indicates a higher level of
confidence.
|
8-14 Day Temperature
Outlook
Updated daily. The 8-14 day outlooks give the confidence that
a forecaster has, given as probability, that the observed
temperature (averaged over the time period of upcoming days 8-14)
will be in the range of one of three possible categories. These are
below (B), normal (N), or above (A) the 1981-2010 climatological
norm for a given area. Blue colors indicate below normal,
orange-red colors indicate above. Darker shading indicates a higher
level of confidence.
|
8-14 Day Precipitation
Outlook
Updated daily. The 8-14 day outlooks give the confidence that
a forecaster has, given as probability, that the observed
precipitation (averaged over the time period of upcoming days 8-14)
will be in the range of one of three possible categories. These are
below (B), normal (N), or above (A) the 1981-2010 climatological
norm for a given area. Brown colors indicate below normal, green
colors indicate above. Darker shading indicates a higher level of
confidence.
|
|---|---|---|---|
|

|
|
|
Climate Prediction Center Long-Term Temperature Outlooks

Updated 3rd week of each month. These maps display the
probability of having temperatures that are above (A), below (B), or
normal (N), as compared to the 1981-2010 30-year climatological norm
for an area. A is based on the 10 warmest years, B on the 10 colest
years, and N on the other years of the period. Orange-red colors
indicate probabilities of above normal temperatures, while blue colors
indicate probabilities of below normal temperatures.
|
1 Month Outlook
From Current Month |
3 Month Outlook
From Current Month |
Months 2-4 Outlook
From Current Month |
Months 3-5 Outlook
From Current Month |
|---|---|---|---|
|
|
|
|
Links:
CPC Seasonal Forecasts
Climate Prediction Center Long-Term Precipitation Outlooks
Updated 3rd week of each month. These maps display the
probability of having precipitation that is above (A), below (B), or
normal (N), as compared to the 1981-2010 30-year climatological norm
for an area. A is based on the 10 wettest years, B on the 10 driest
years, and N on the middle years. Green colors indicate probabilities
of above normal, while brown colors indicate probabilities below
normal.
|
1 Month Outlook
From Current Month |
3 Month Outlook
From Current Month |
Months 2-4 Outlook
From Current Month |
Months 3-5 Outlook
From Current Month |
|---|---|---|---|

|
|
|
|
Links:
CPC Seasonal Forecasts
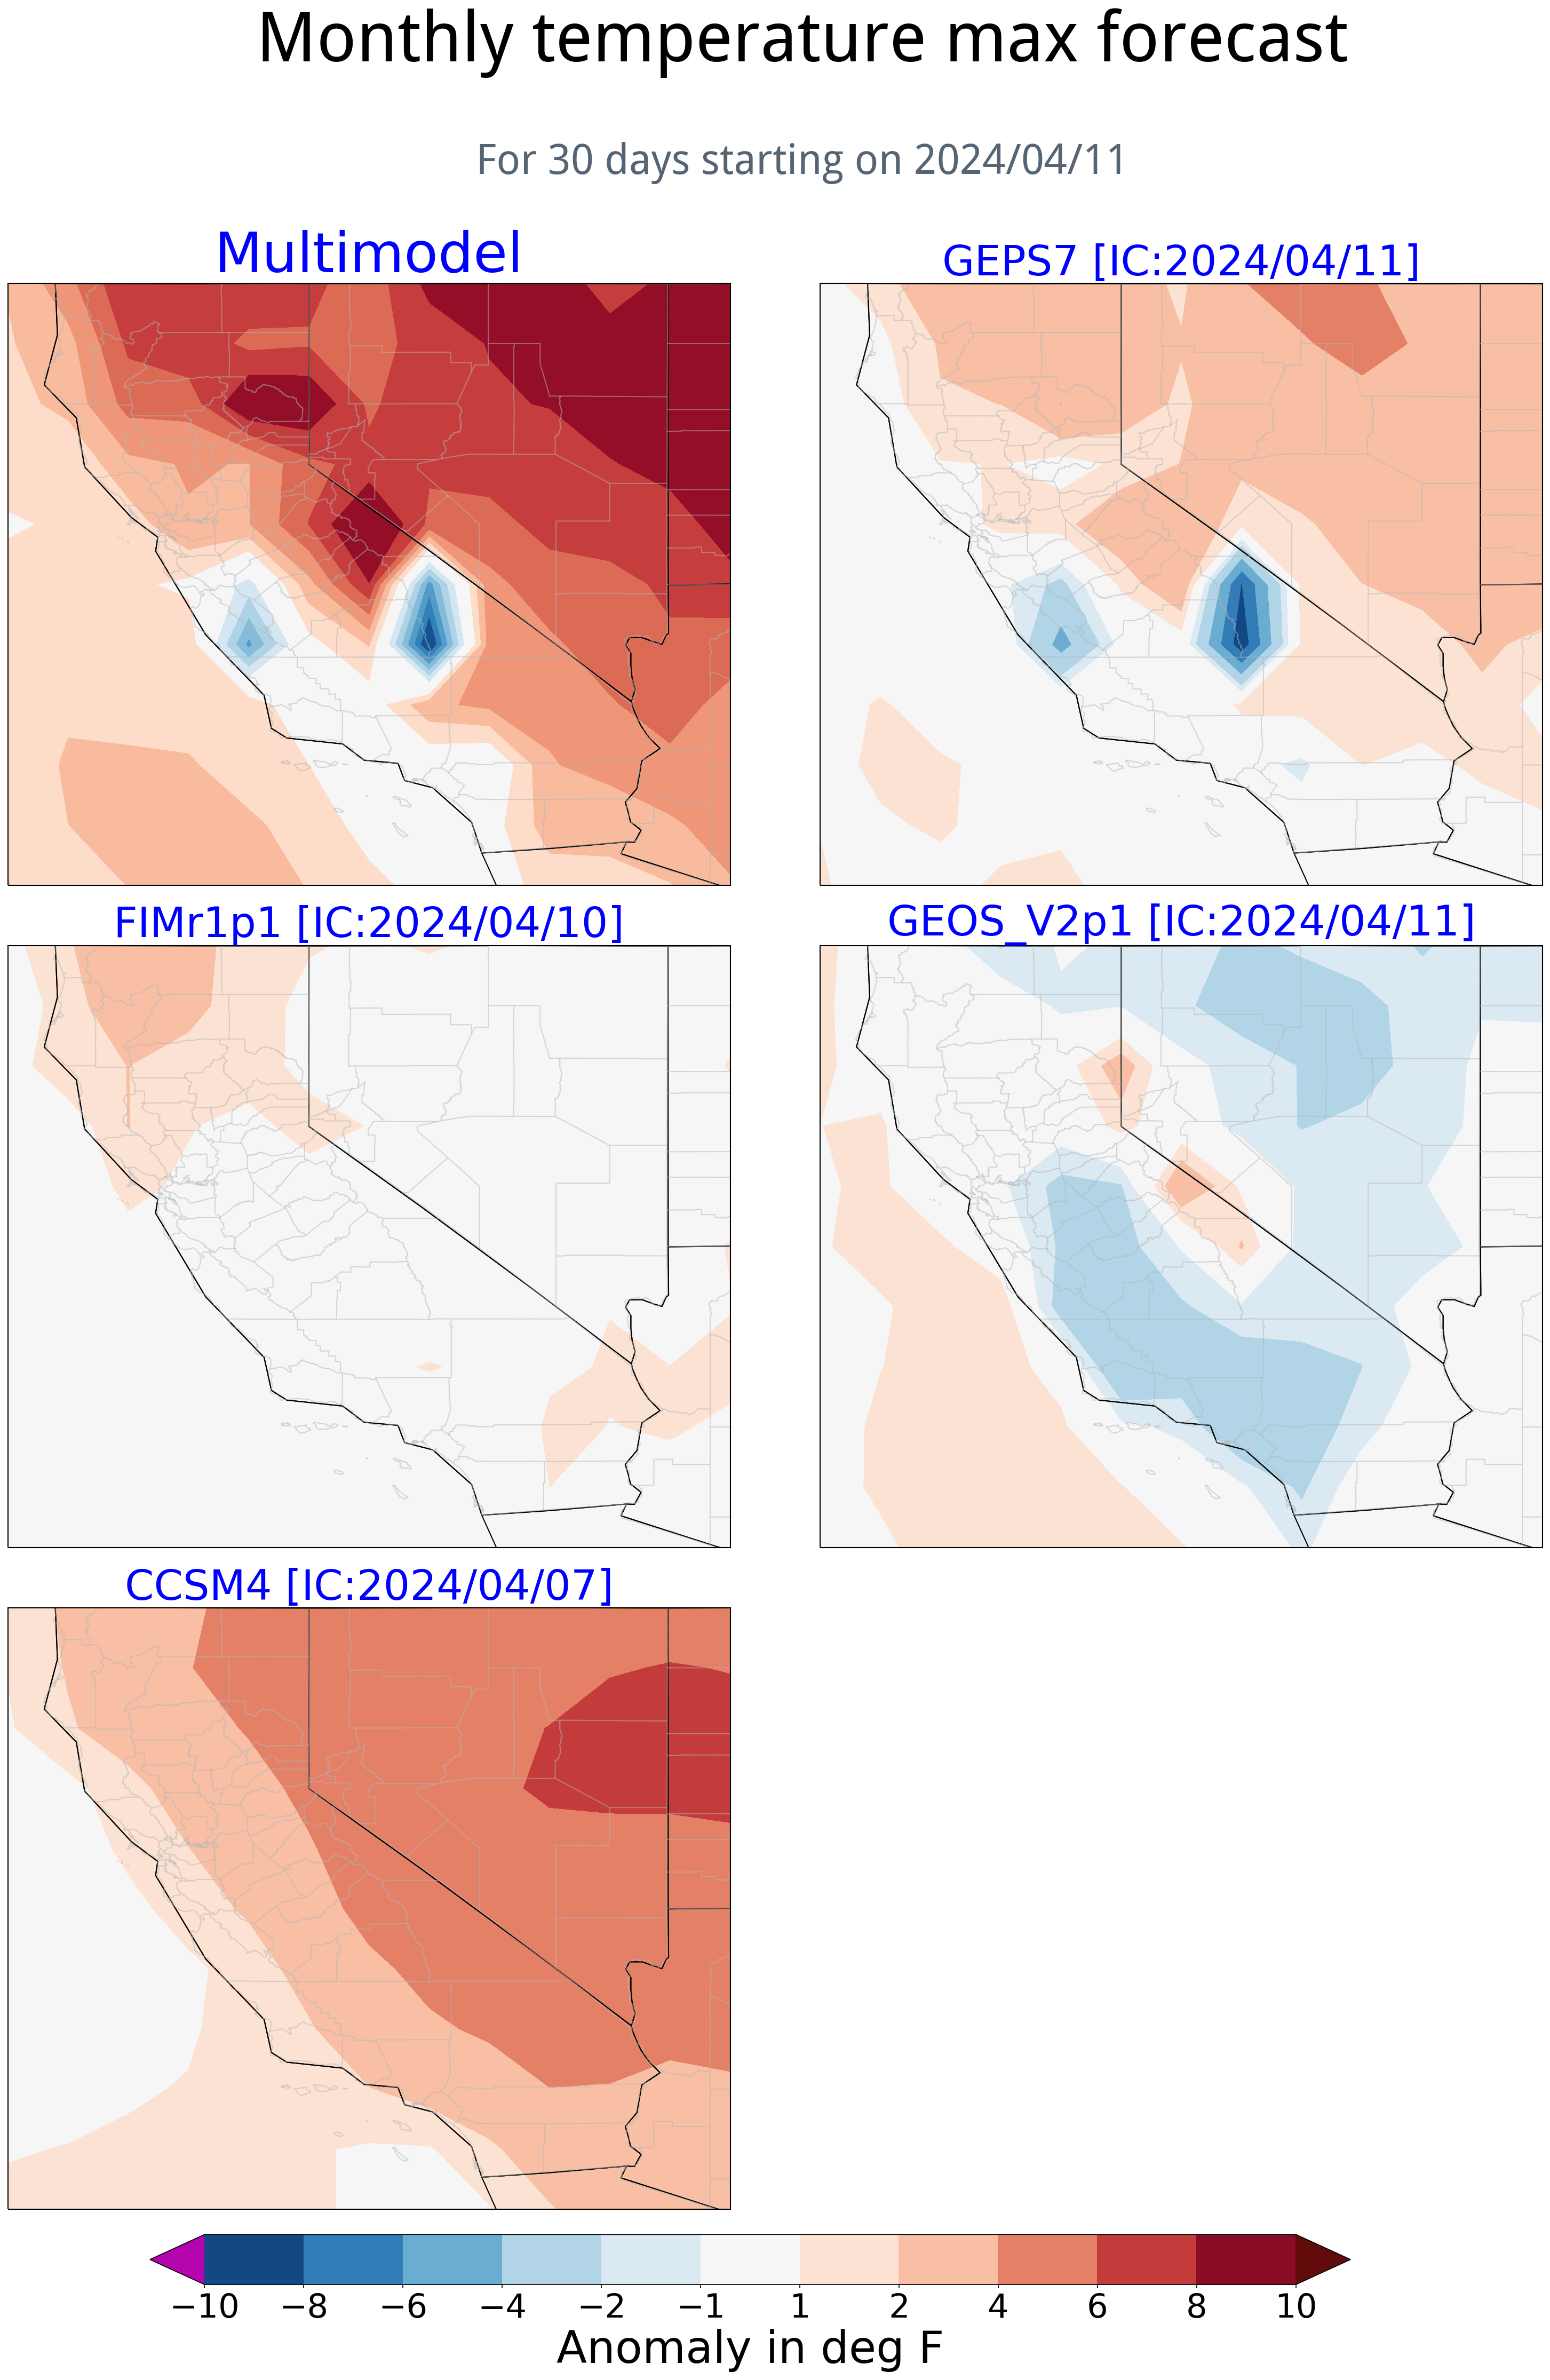
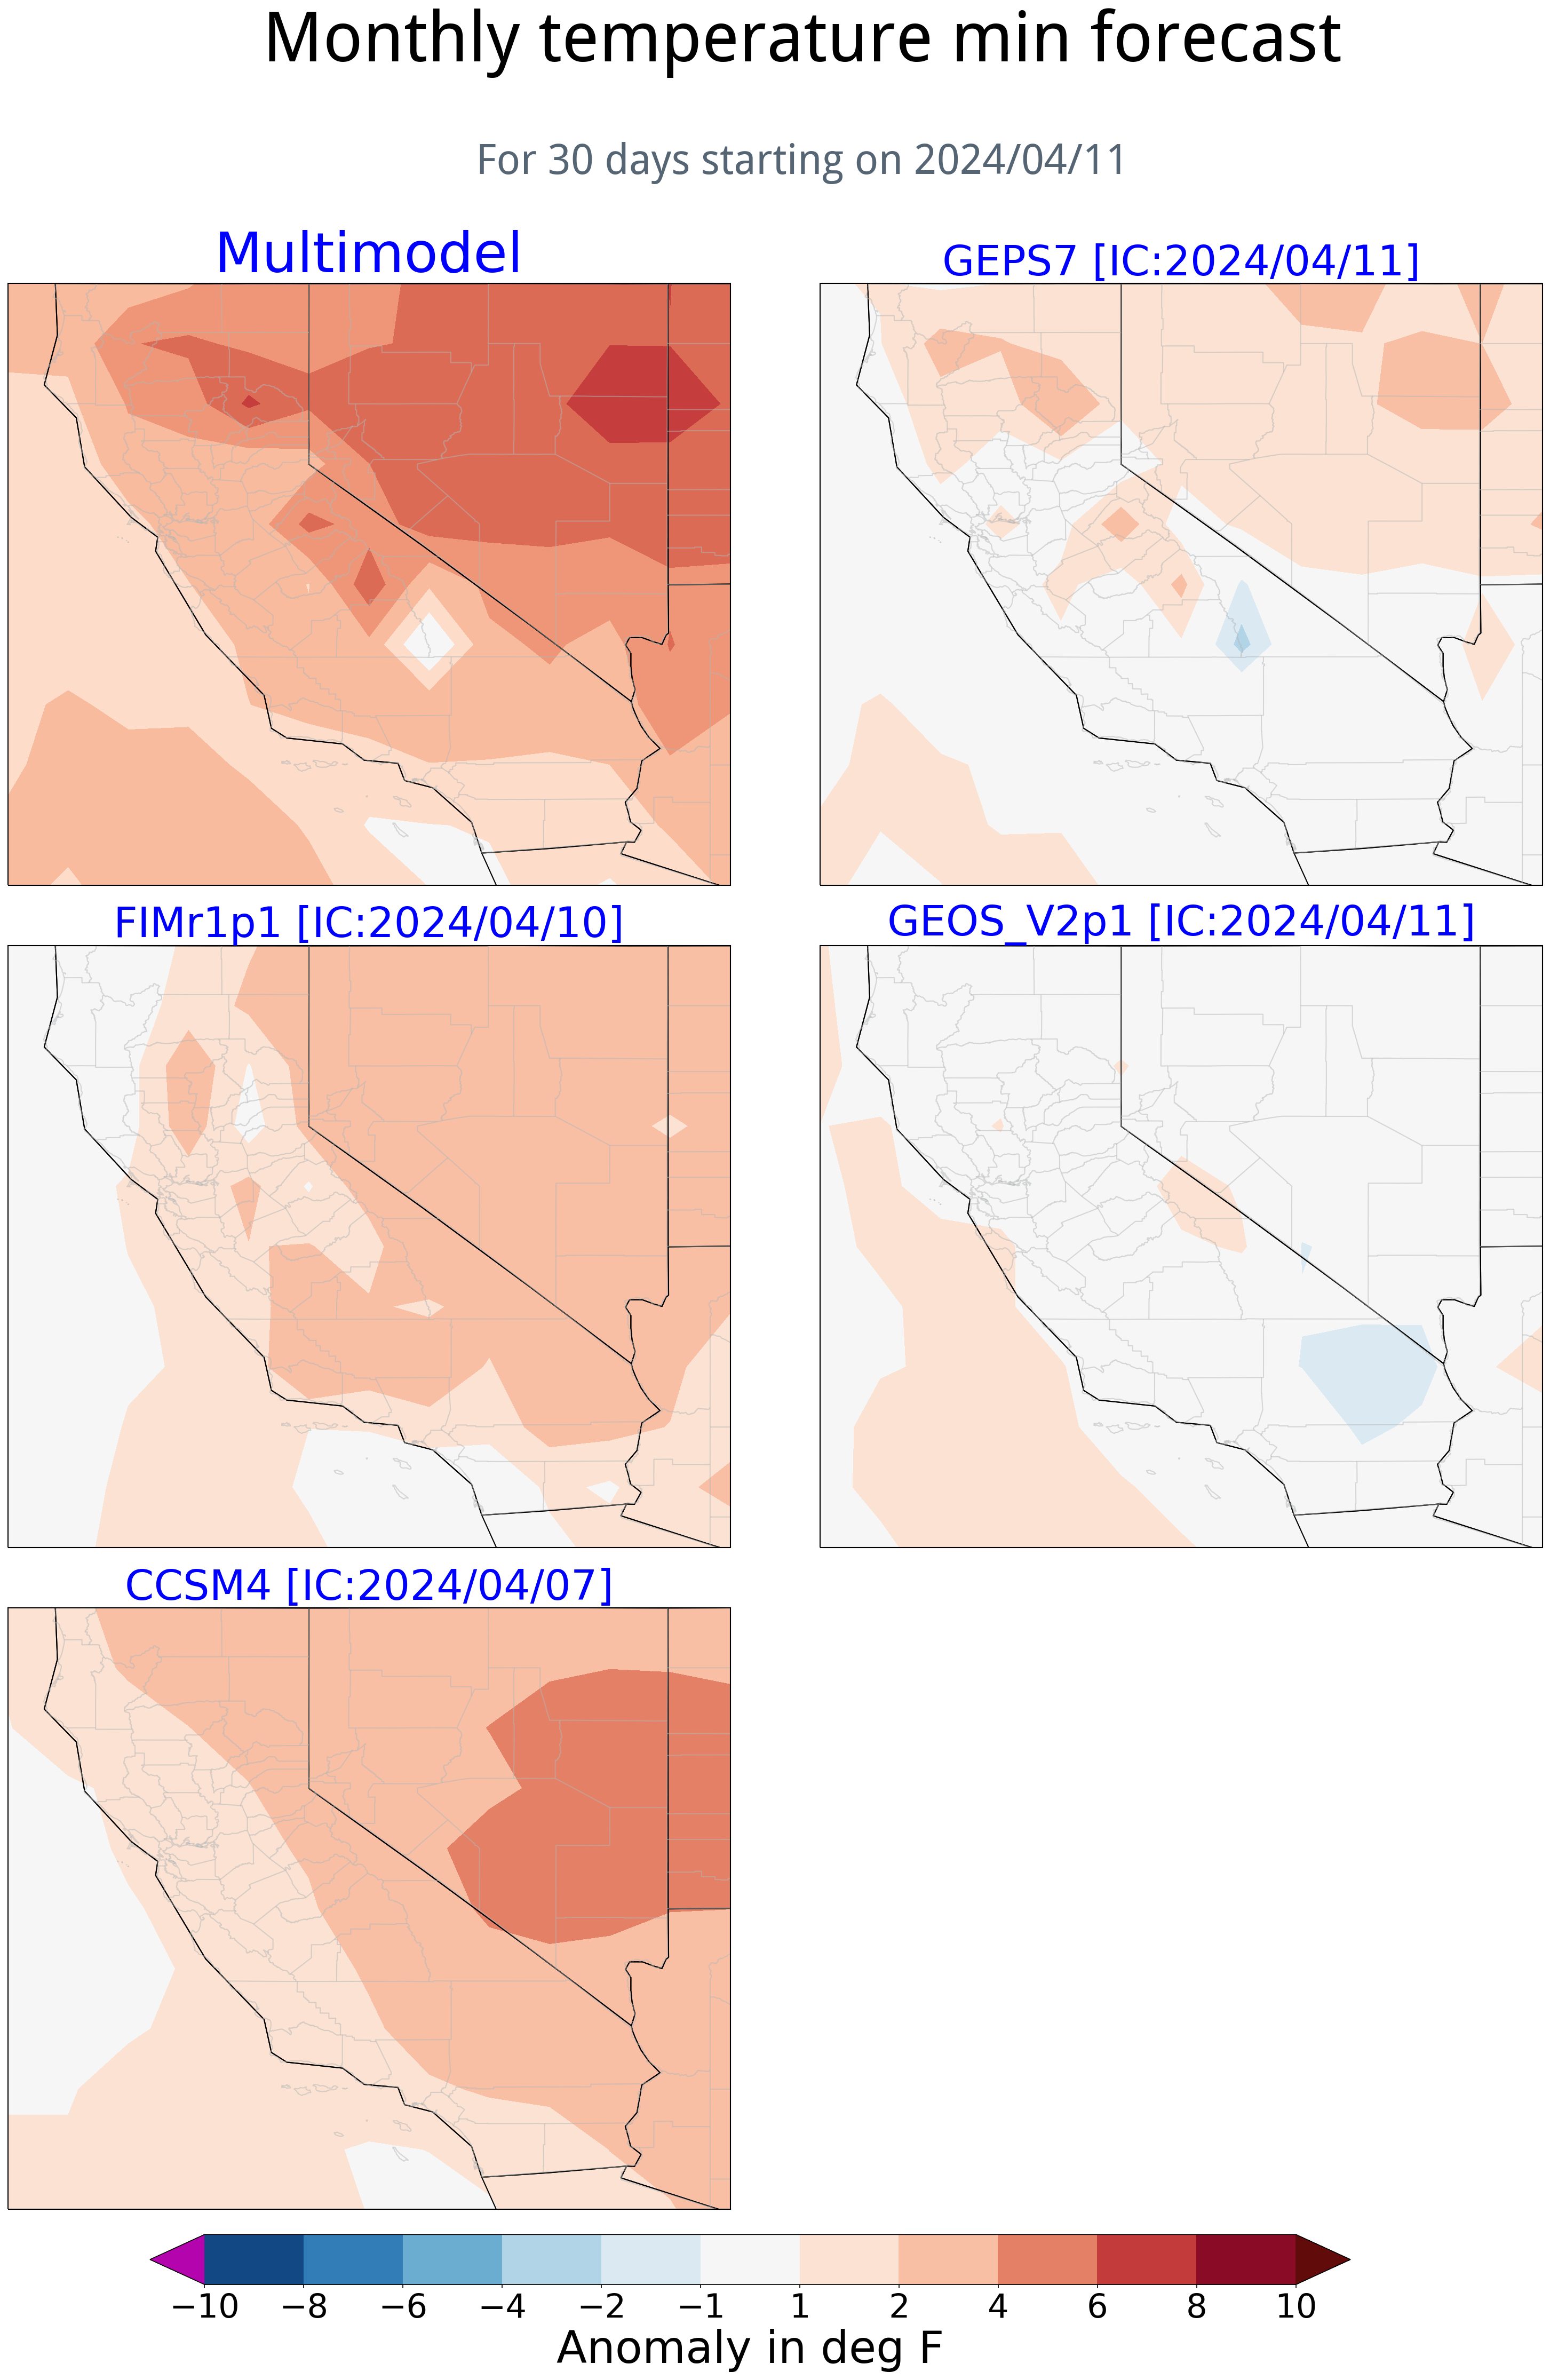
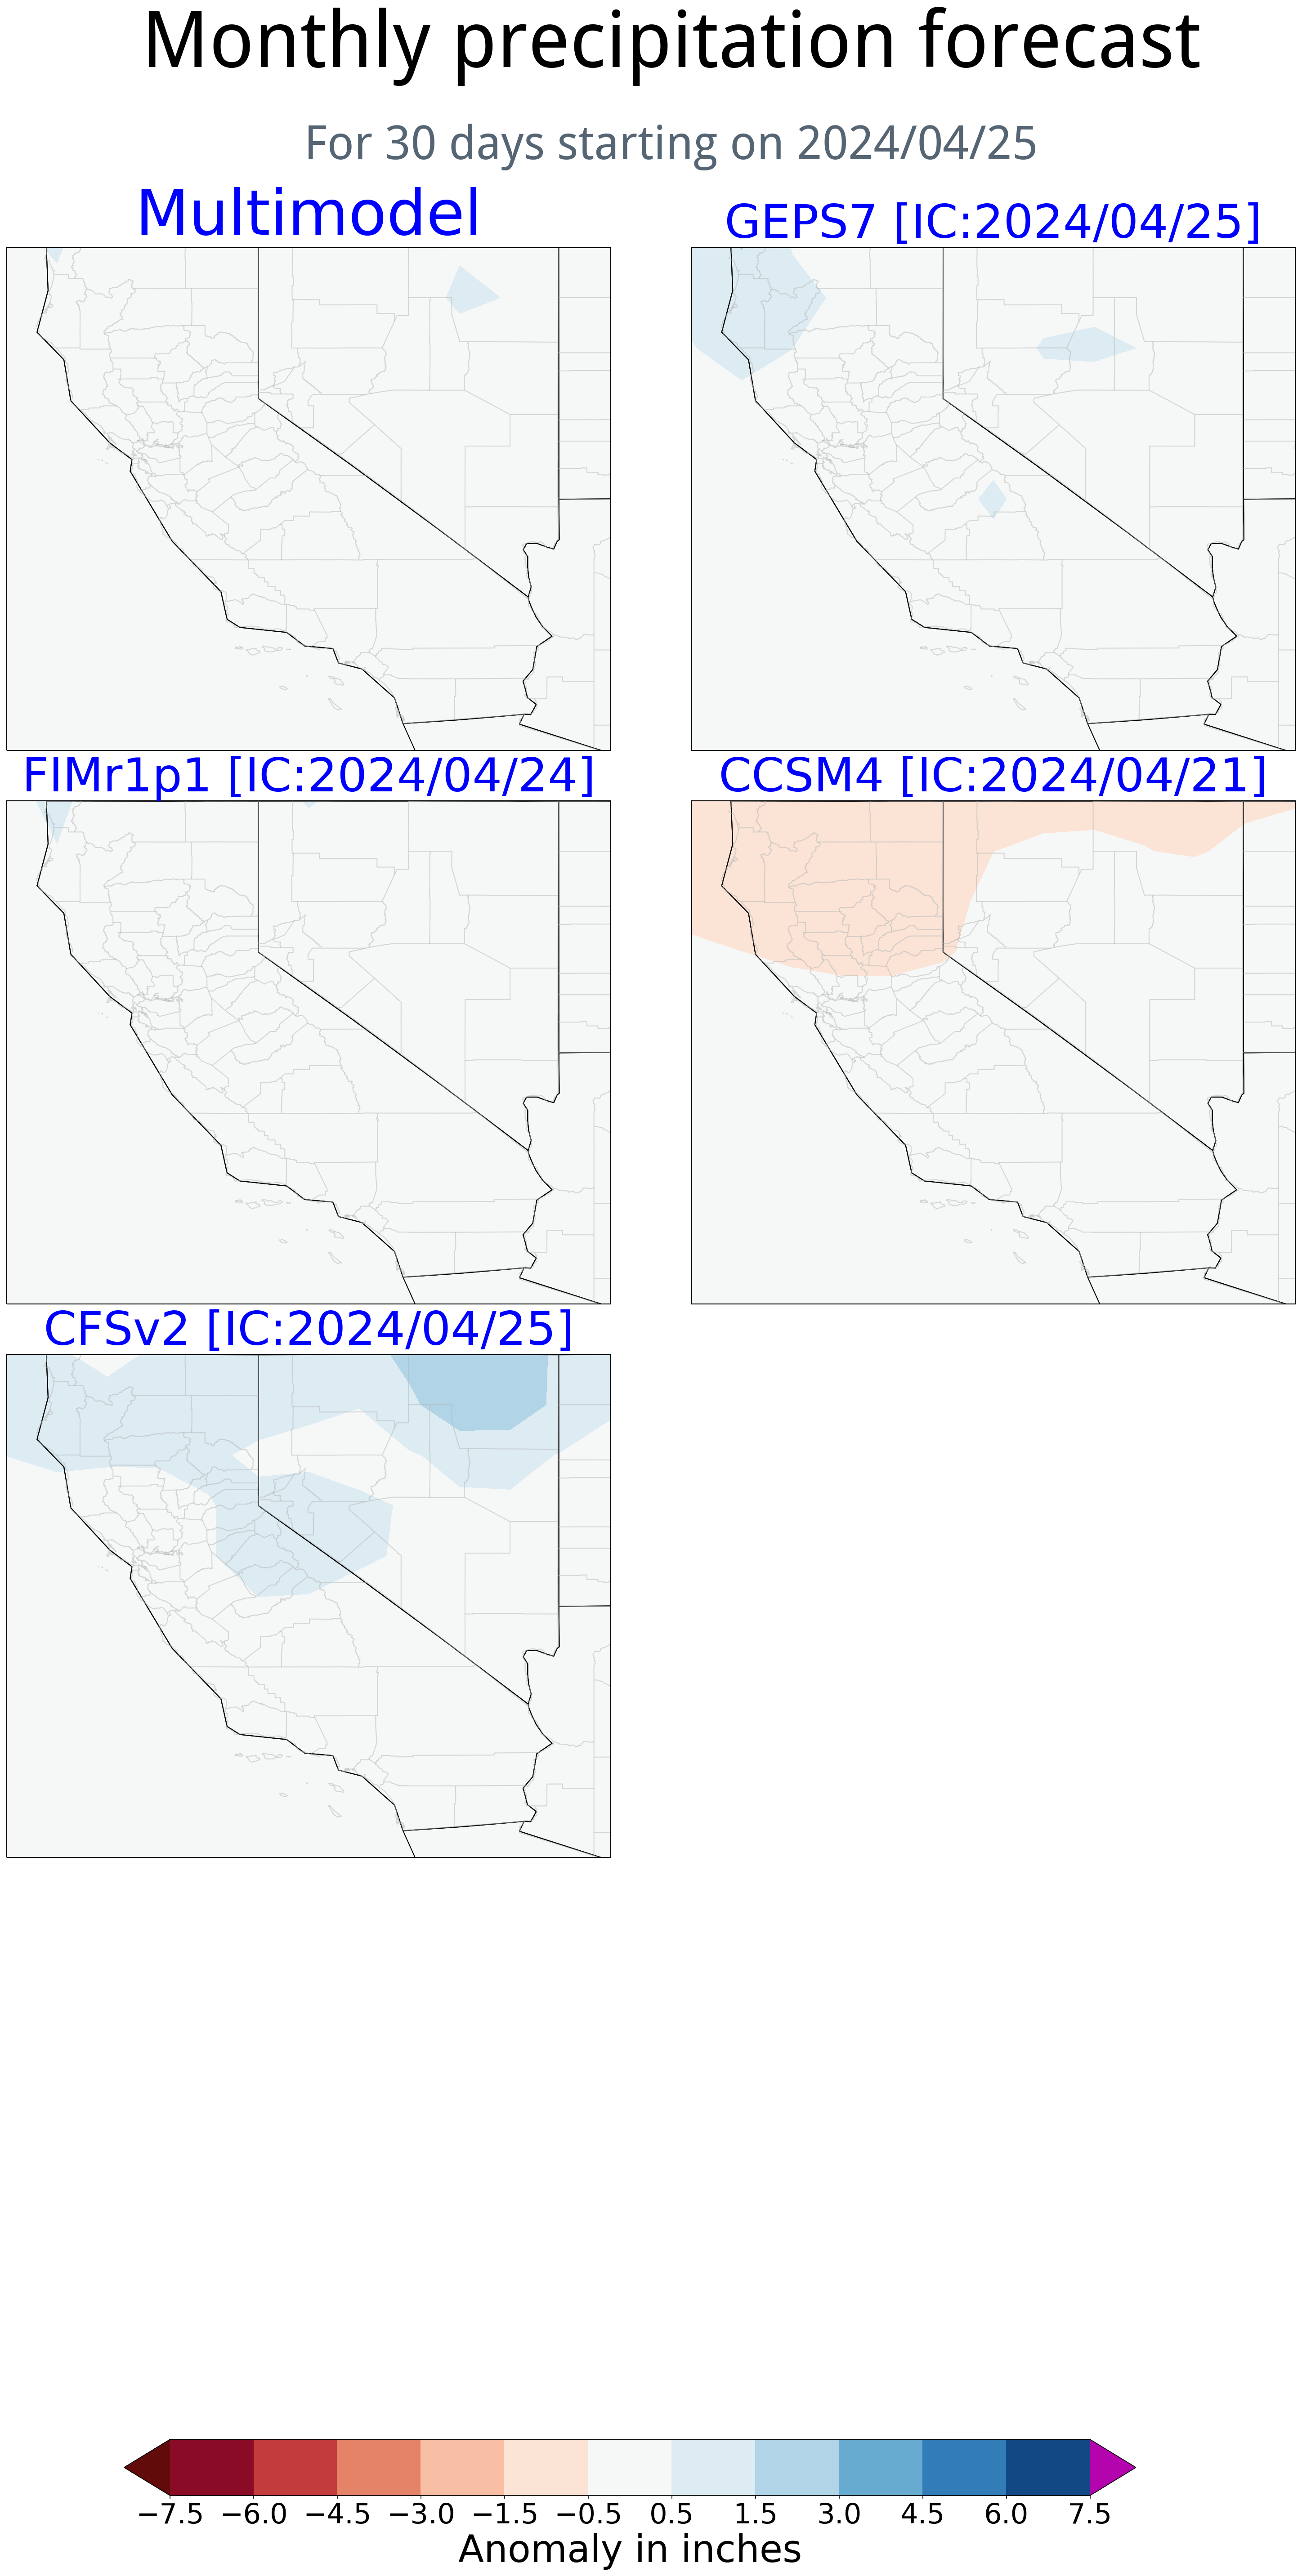
30-Day North American Multimodel Subseasonal forecast project (NMME SubX)
Updated weekly each Thursday. Forecast anomaly over the next 30 days based on multiple climate models.
Anomaly is calculated relative to each model's own historical forecast climatology which consists of forecasts
made for the target period during 1999-2016. Forecast data are obtained from the North American Multimodel
Subseasonal forecast project (NMME SubX). This map gets updated every Thursday.
| Maximum Temperature | Minimum Temperature | Precipitation |
|---|---|---|
|
|
|
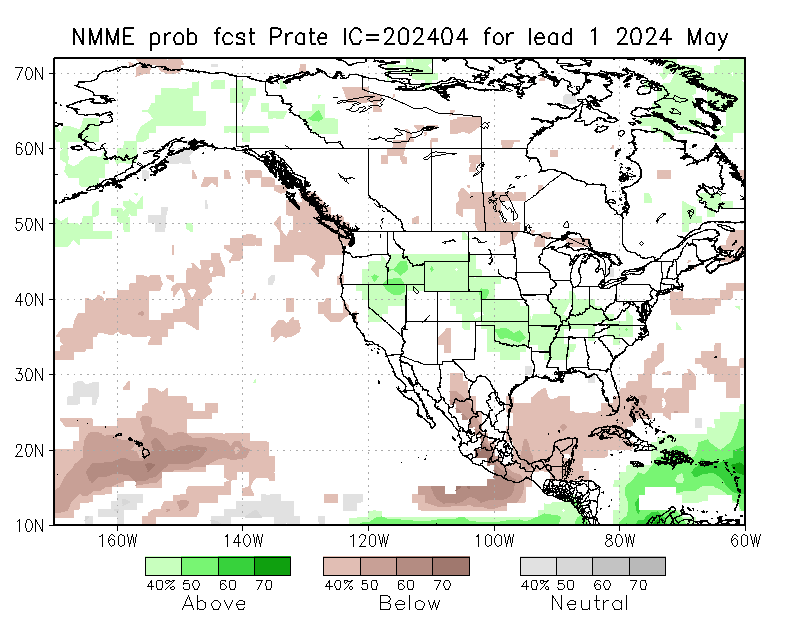
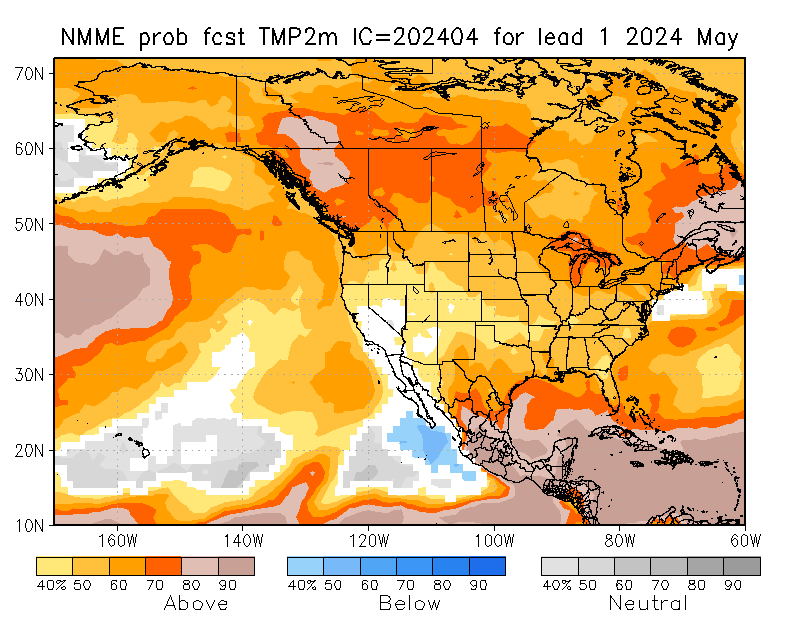
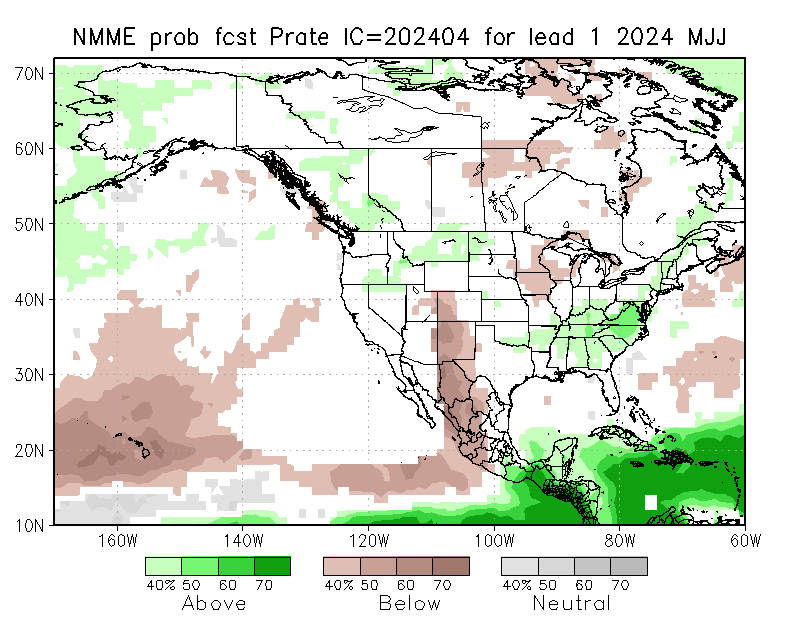
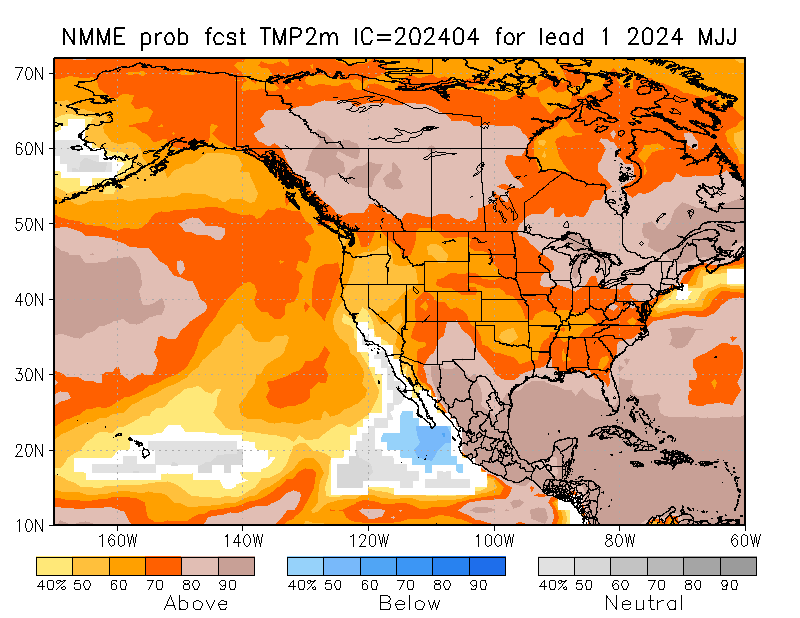
National Multi-Model Ensemble *Experimental* Forecasts (NMME)
Updated monthly. Experimental multi-model temperature and
precipitation forecasts from NOAA Climate Prediction Center.
|
1-Month Probabilistic
Precipitation |
1-Month Probabilistic
Temperature |
3-Month Probabilistic
Precipitation |
3-Month Probabilistic
Temperature |
|---|---|---|---|
|
|
|
|
Significant Wildland Fire Potential Outlook
Updated first of each month. Outlooks for current month,
following month, and two months beyond that. These assessments are
designed to inform decision makers for proactive wildland fire
management, thus better protecting lives and property, reducing
firefighting costs and improving firefighting efficiency. The following
maps represent the cumulative forecasts of the eleven Geographic Area
Predictive Services Units and the National Predictive Services Unit.
| Current Month Outlook | 1 Month Outlook | 2 Month Outlook |
|---|---|---|

|

|

|
Links:
Predictive Services Outlooks
Streamflow Forecasts
|
NRCS Truckee R.
@ Farad
Daily Exceedance Guidance Forecasts – displays five
exceedance guidance forecasts (colored lines) versus historical
range of variability (gray background) and the official monthly
forecasts (yellow squares).
|
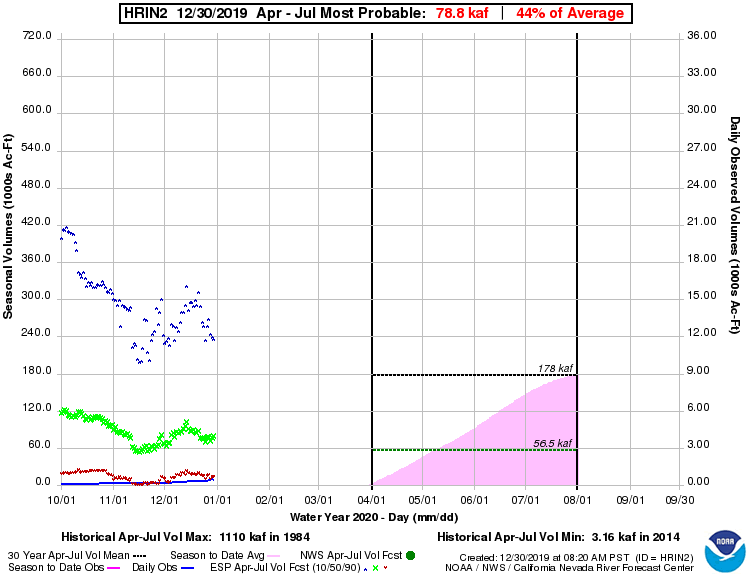
CNRFC Humboldt R.
@ Imlay
Updated daily. Streamflow forecasts by ESP and NWS (green,
yellow) and actual daily observations (blue).
|
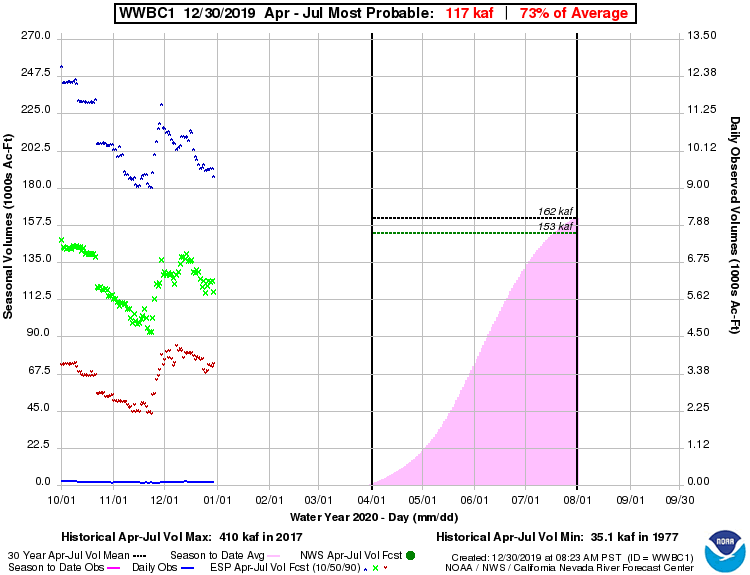
CNRFC W. Walker R.
b. Little Walker
Updated daily. Streamflow forecasts by ESP and NWS (green,
yellow) and actual daily observations (blue).
|
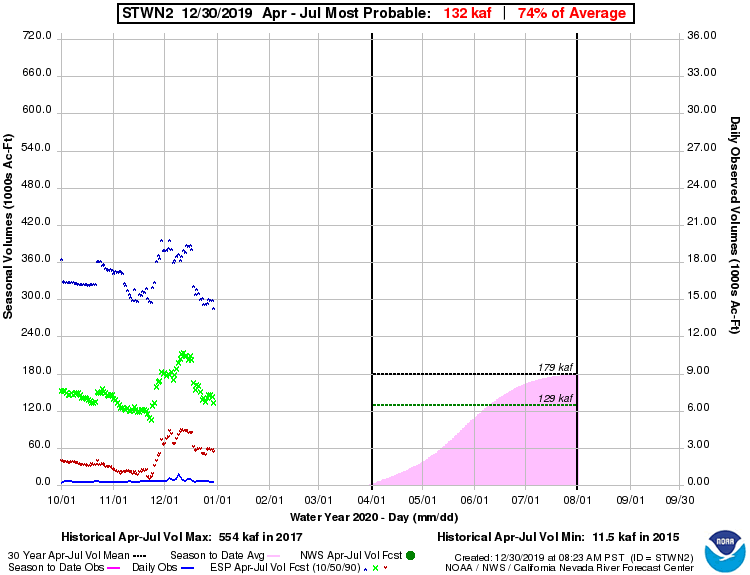
CNRFC Carson R.
@ Carson City
Updated daily. Streamflow forecasts by ESP and NWS (green,
yellow) and actual daily observations (blue).
|
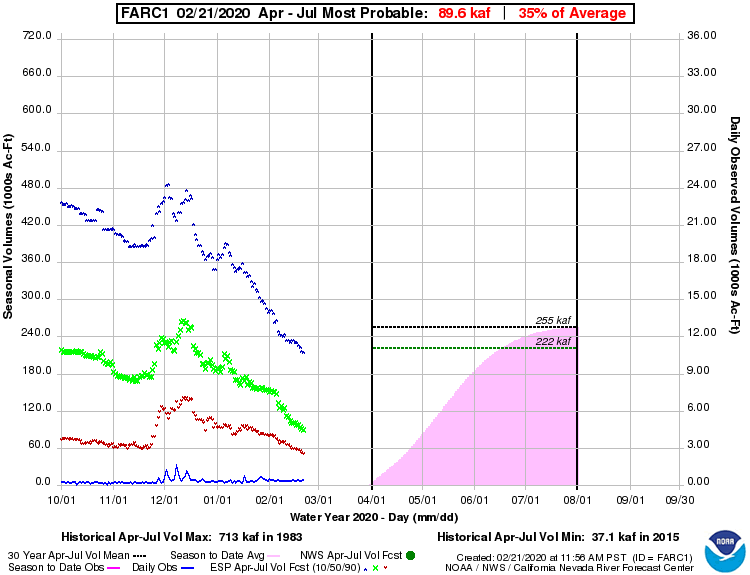
CNRFC Truckee R.
@ Farad
Updated daily. Streamflow forecasts by ESP and NWS (green,
yellow) and actual daily observations (blue).
|
|---|---|---|---|---|
|
|
|
|
|